National Assessment Governing Board Infographics
For The National Assessment Governing Board
Role: Designer
The National Assessment of Educational Progress (NAEP) is the largest nationally representative, continuing evaluation of the condition of education in the United States. The National Assessment Governing Board is the independent, nonpartisan body that sets policy for NAEP.
NAEP informs the public about what American students know and can do in various subject areas, and compares achievement among states, large urban districts, and various student groups. It is essentially The Nation’s Report Card, which happens to be another name for it.
This means that tons of data is being collected across the whole country, and it all needs to be decoded into formats that are usable and accessible. Contributing to that undertaking, I created several infographics for The Governing Board that attractively visualize complex quantitative and qualitative information.
NAEP Frameworks Infographics
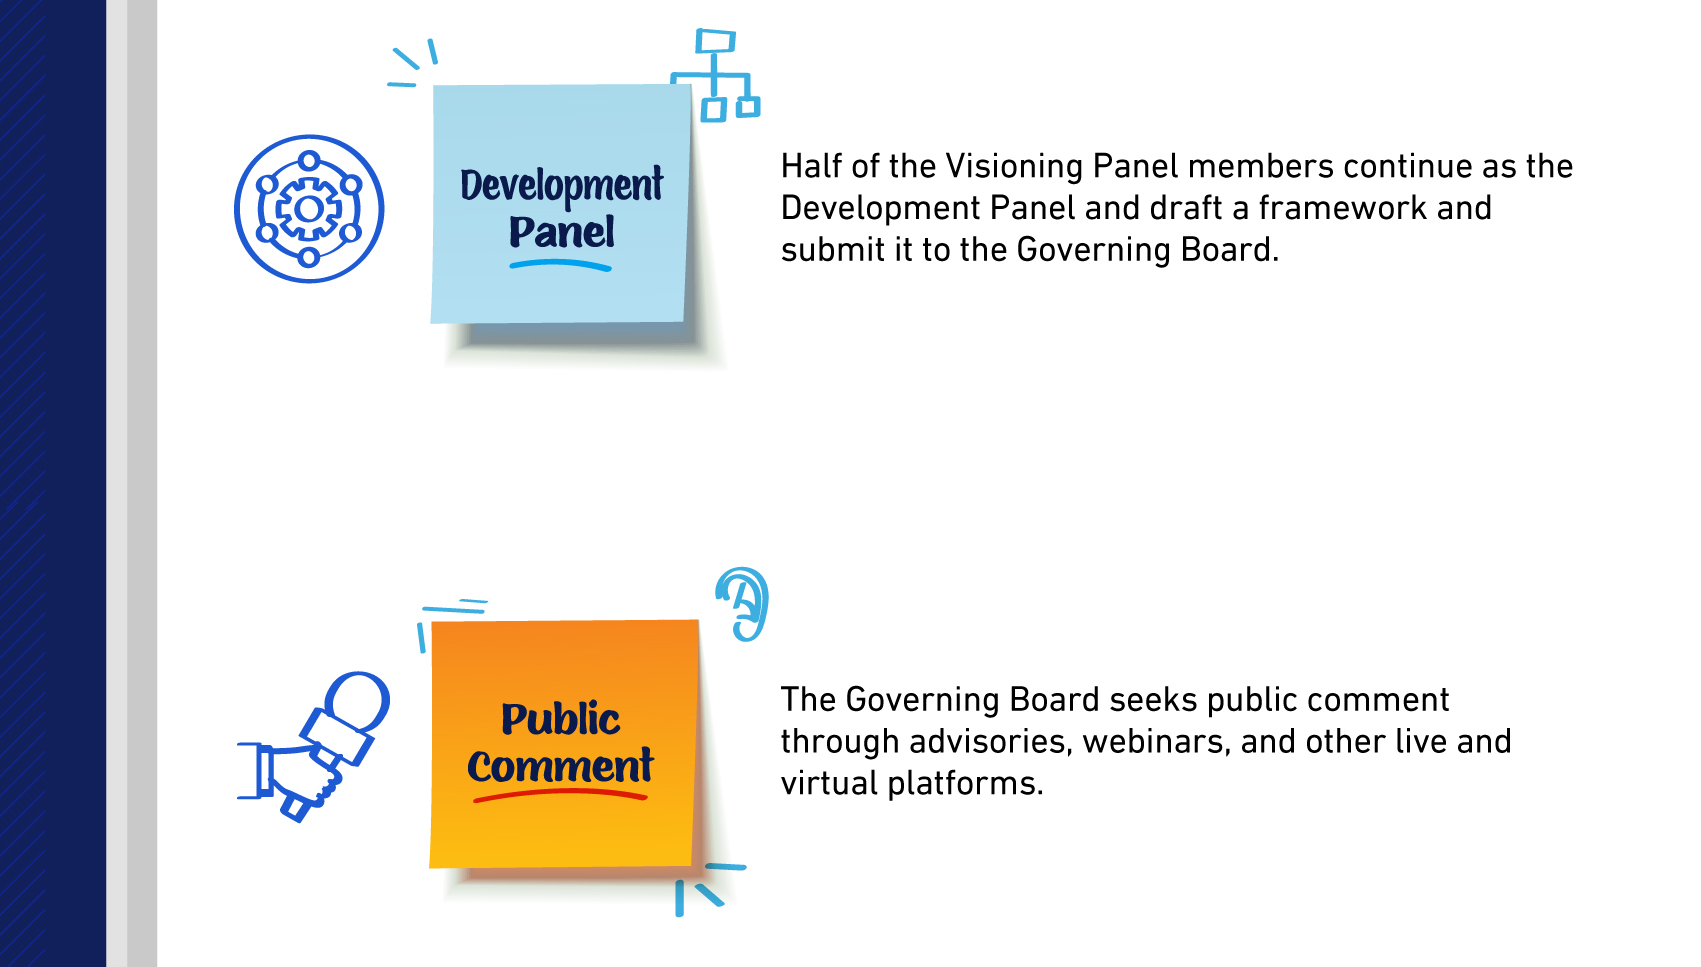
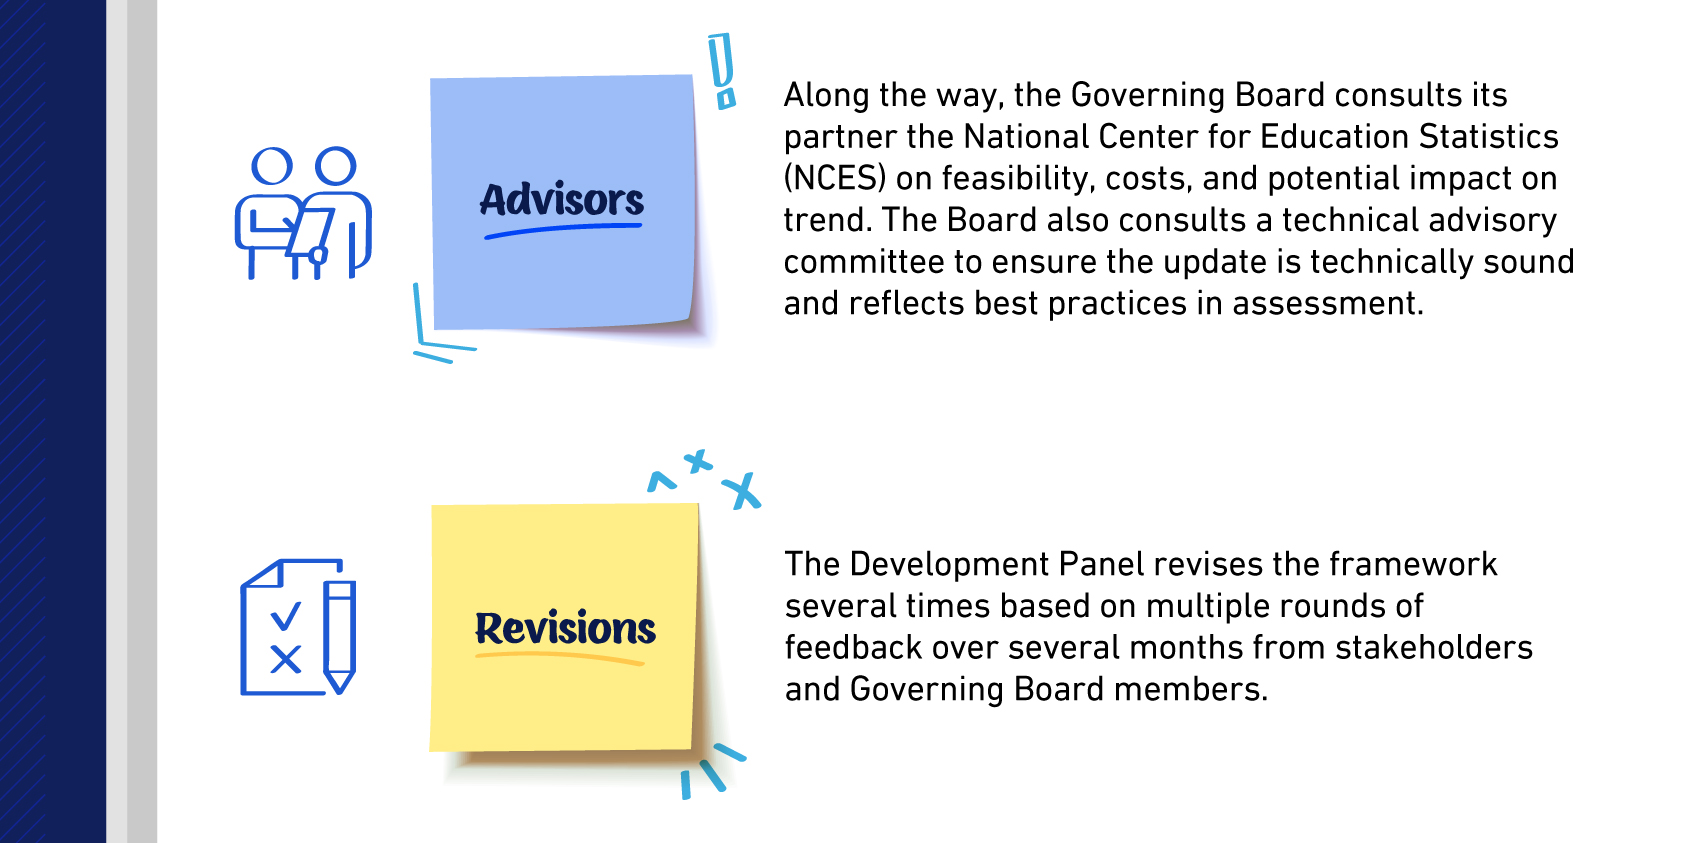
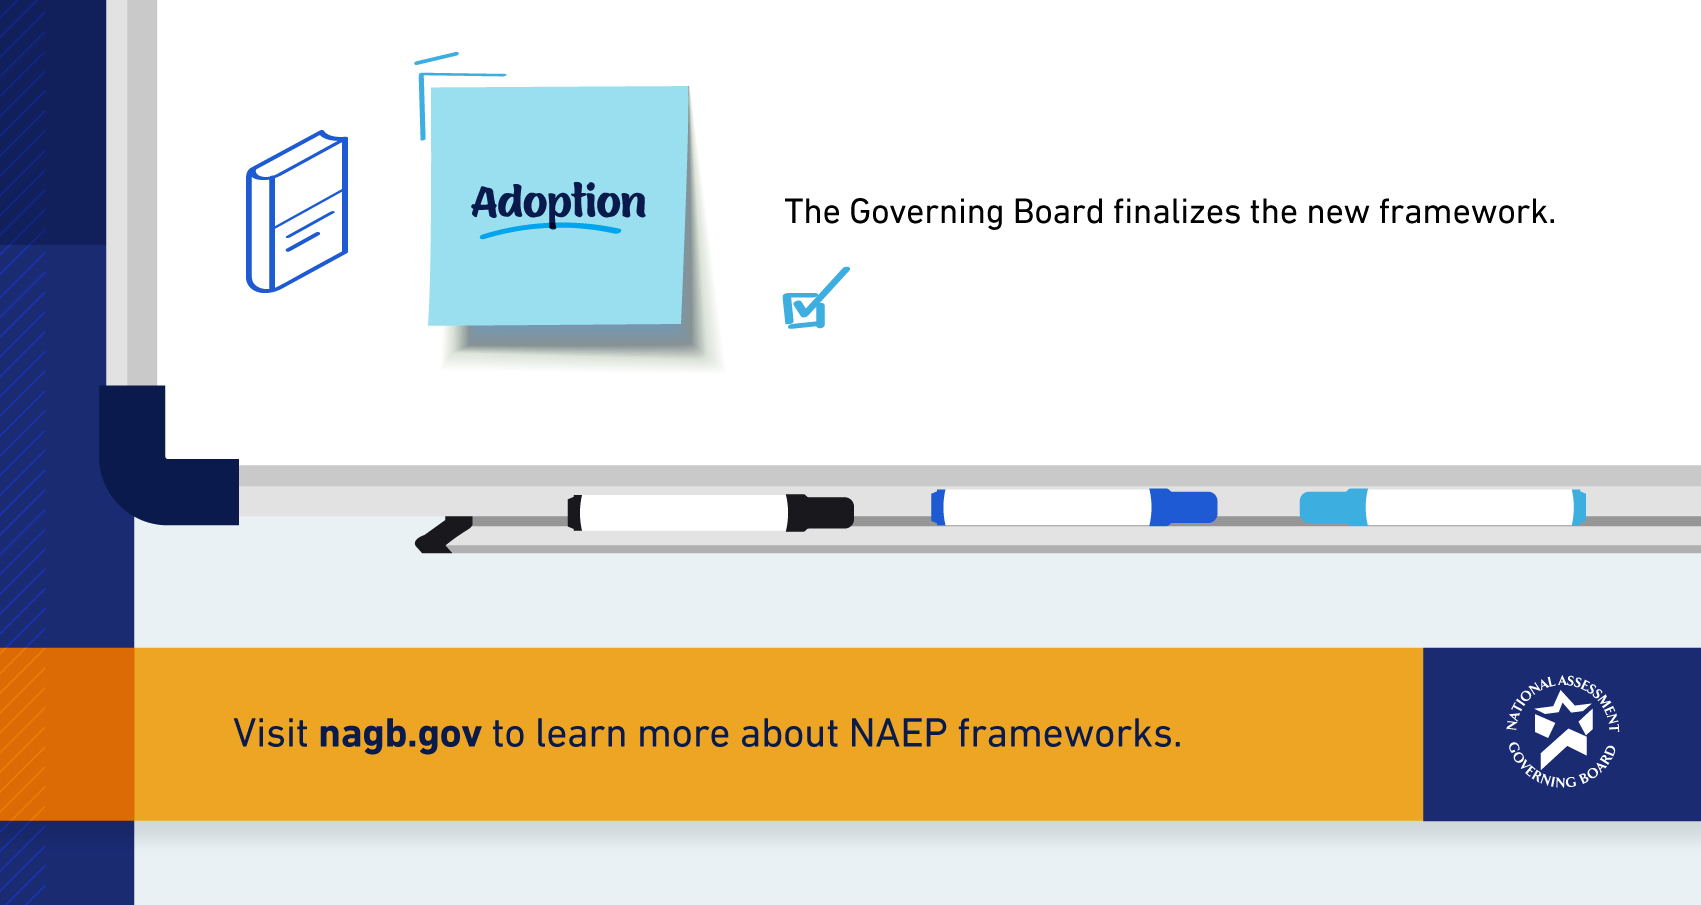
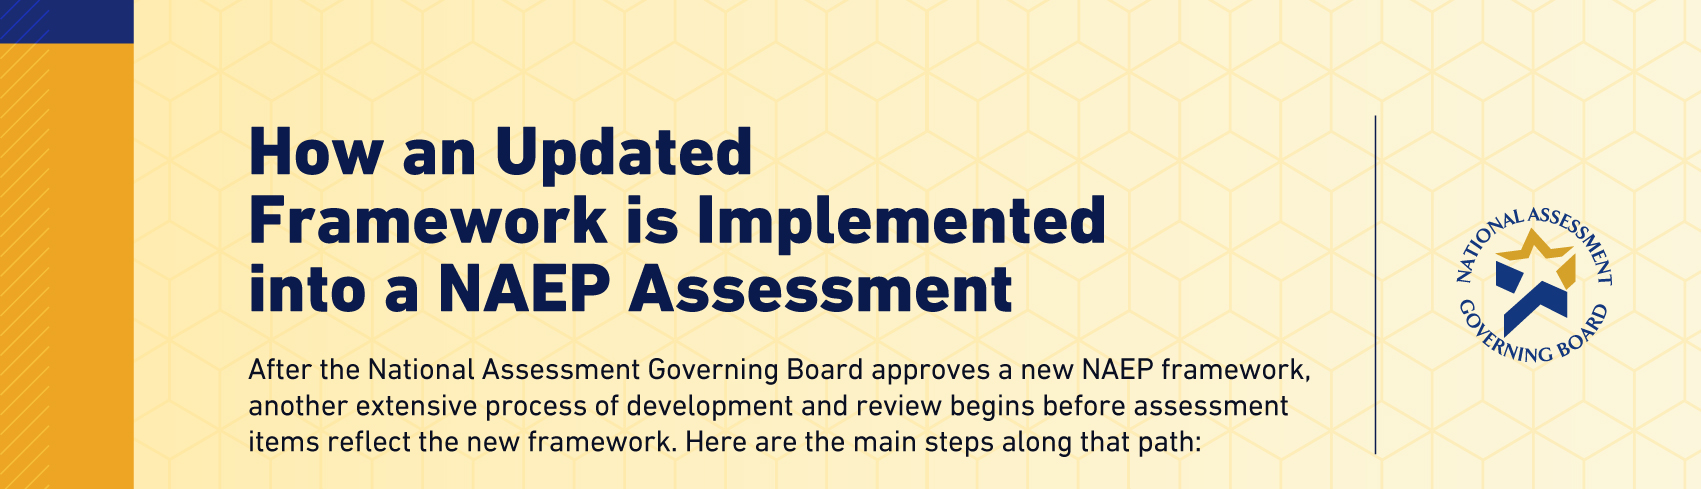
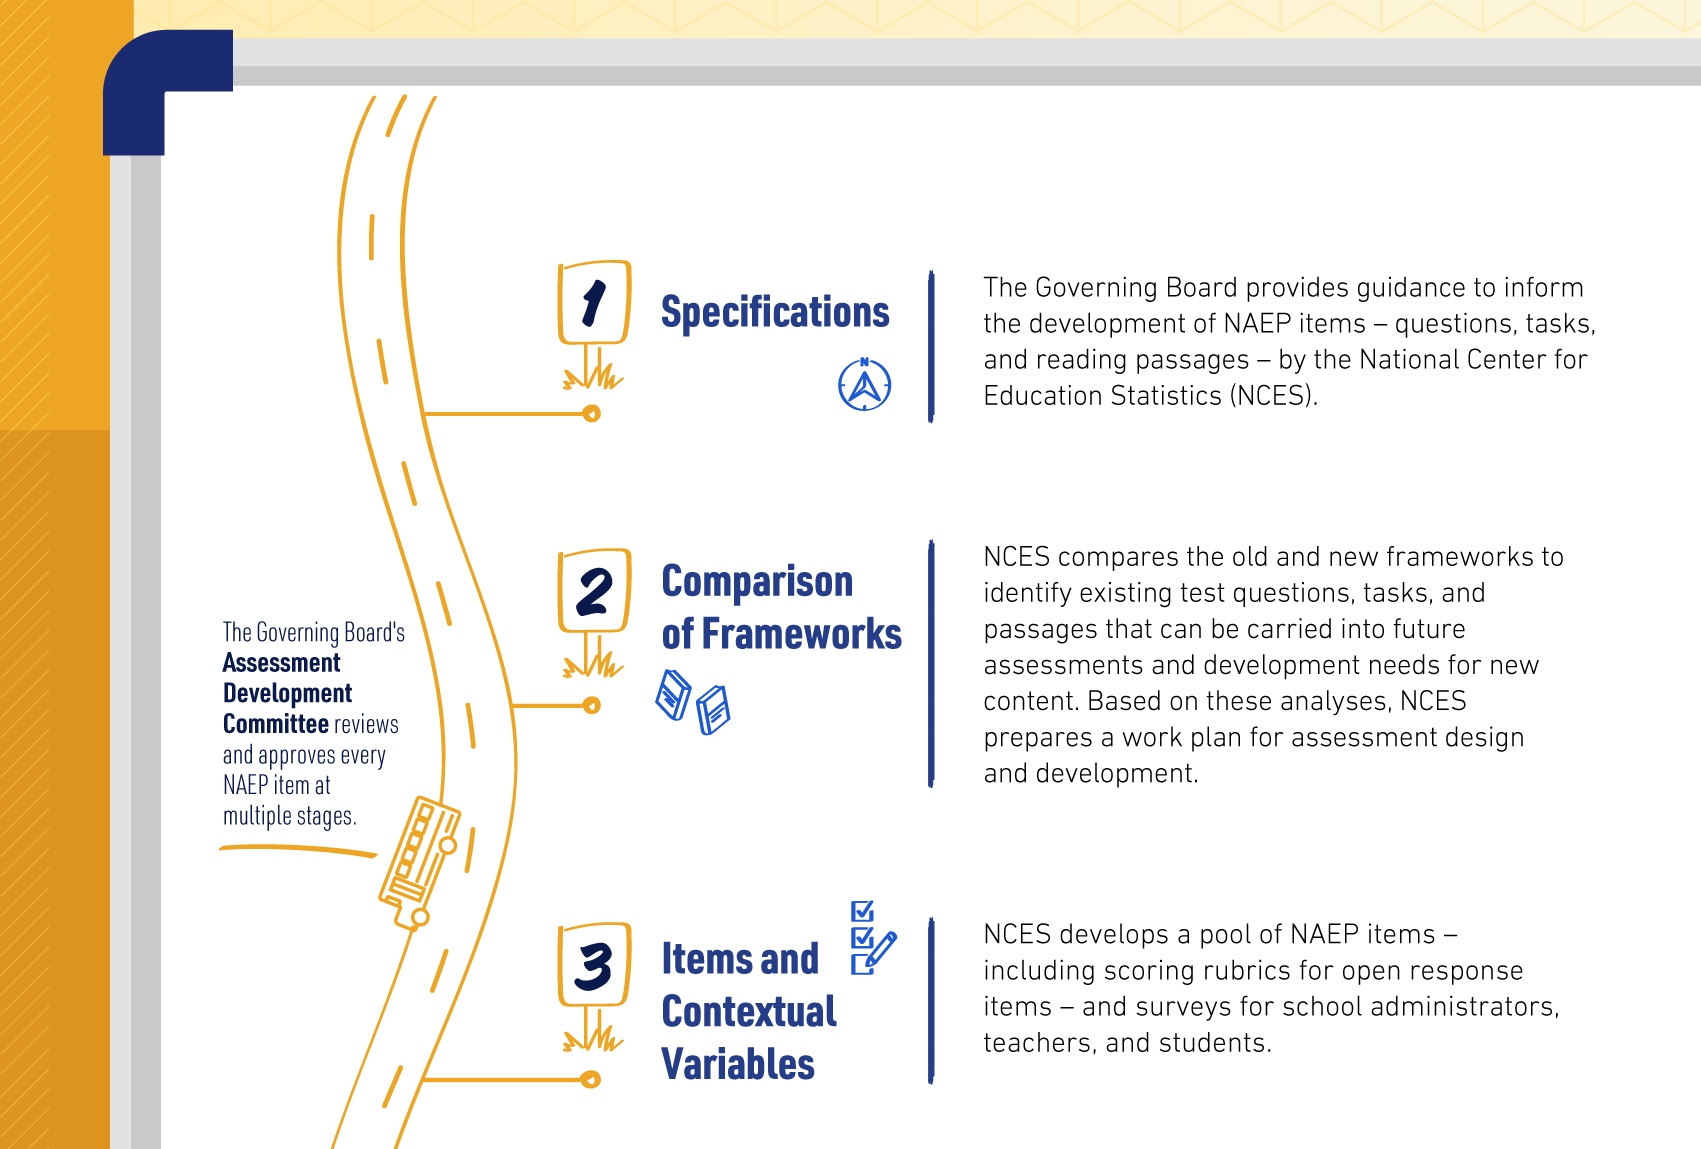
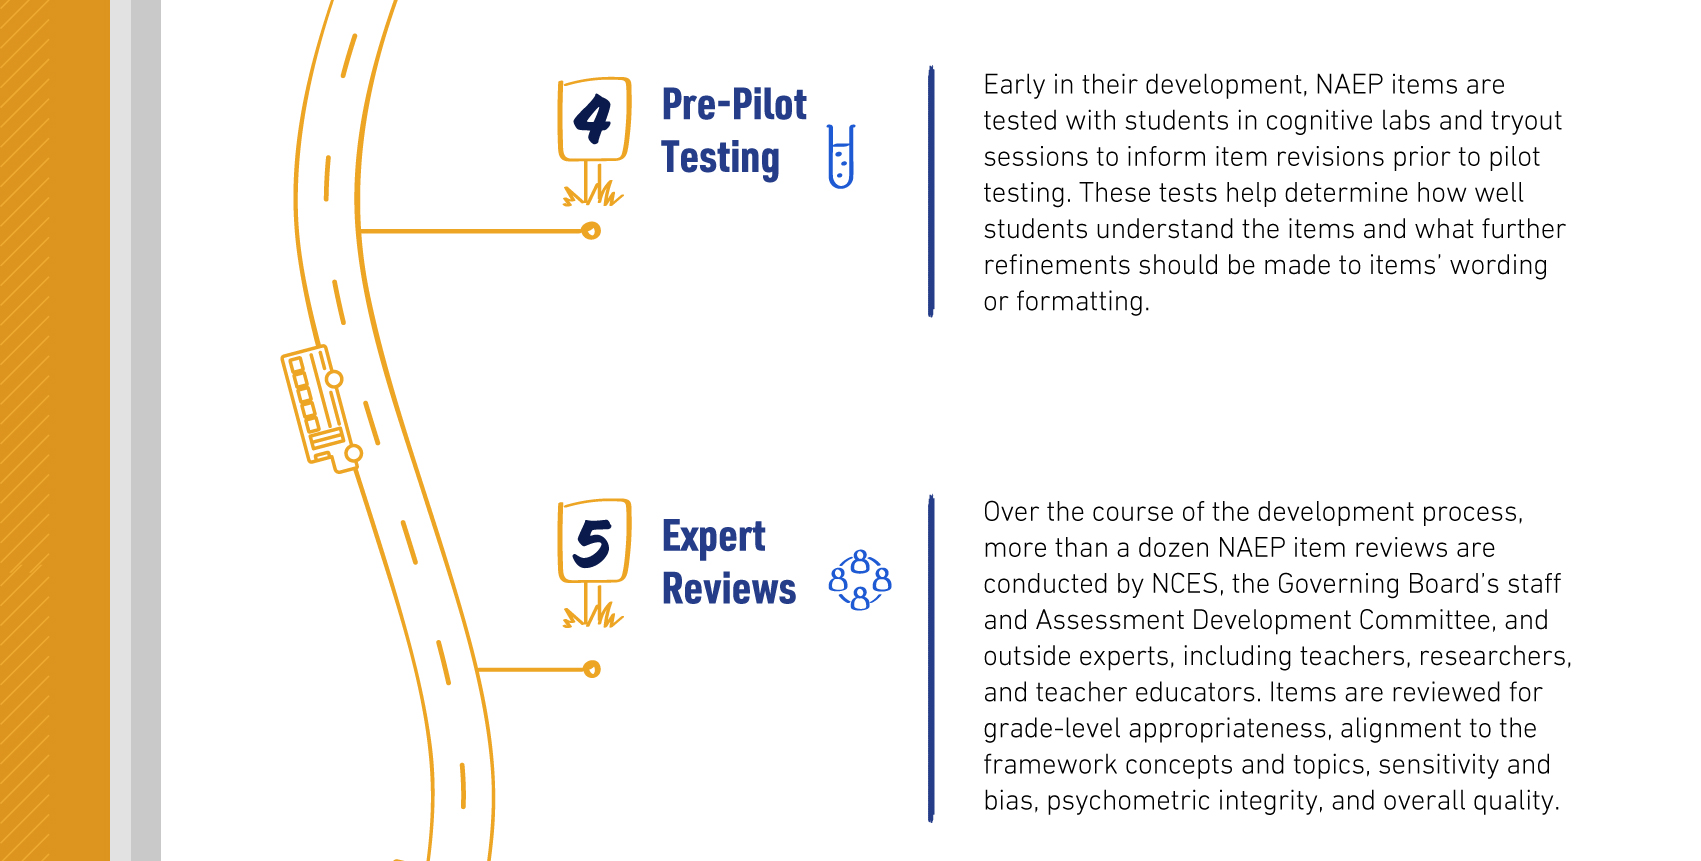
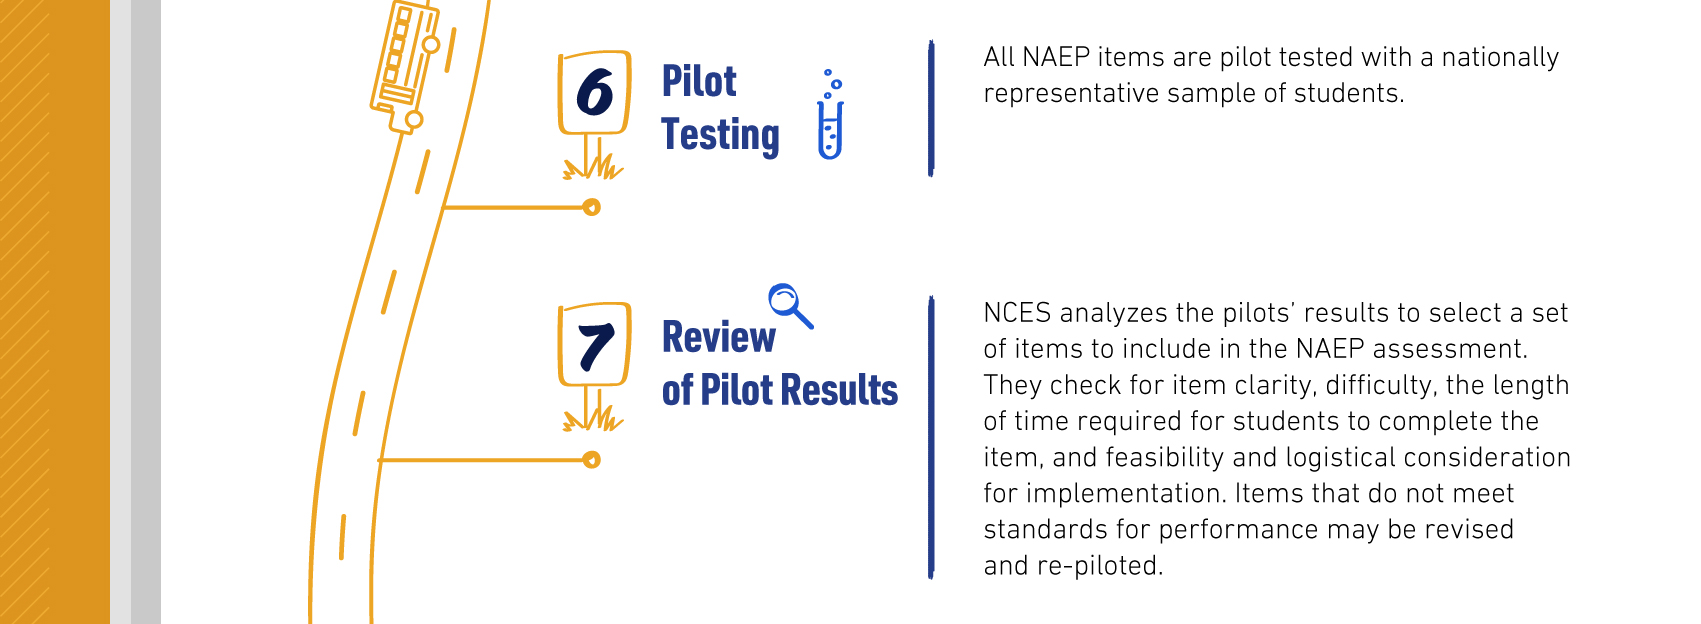
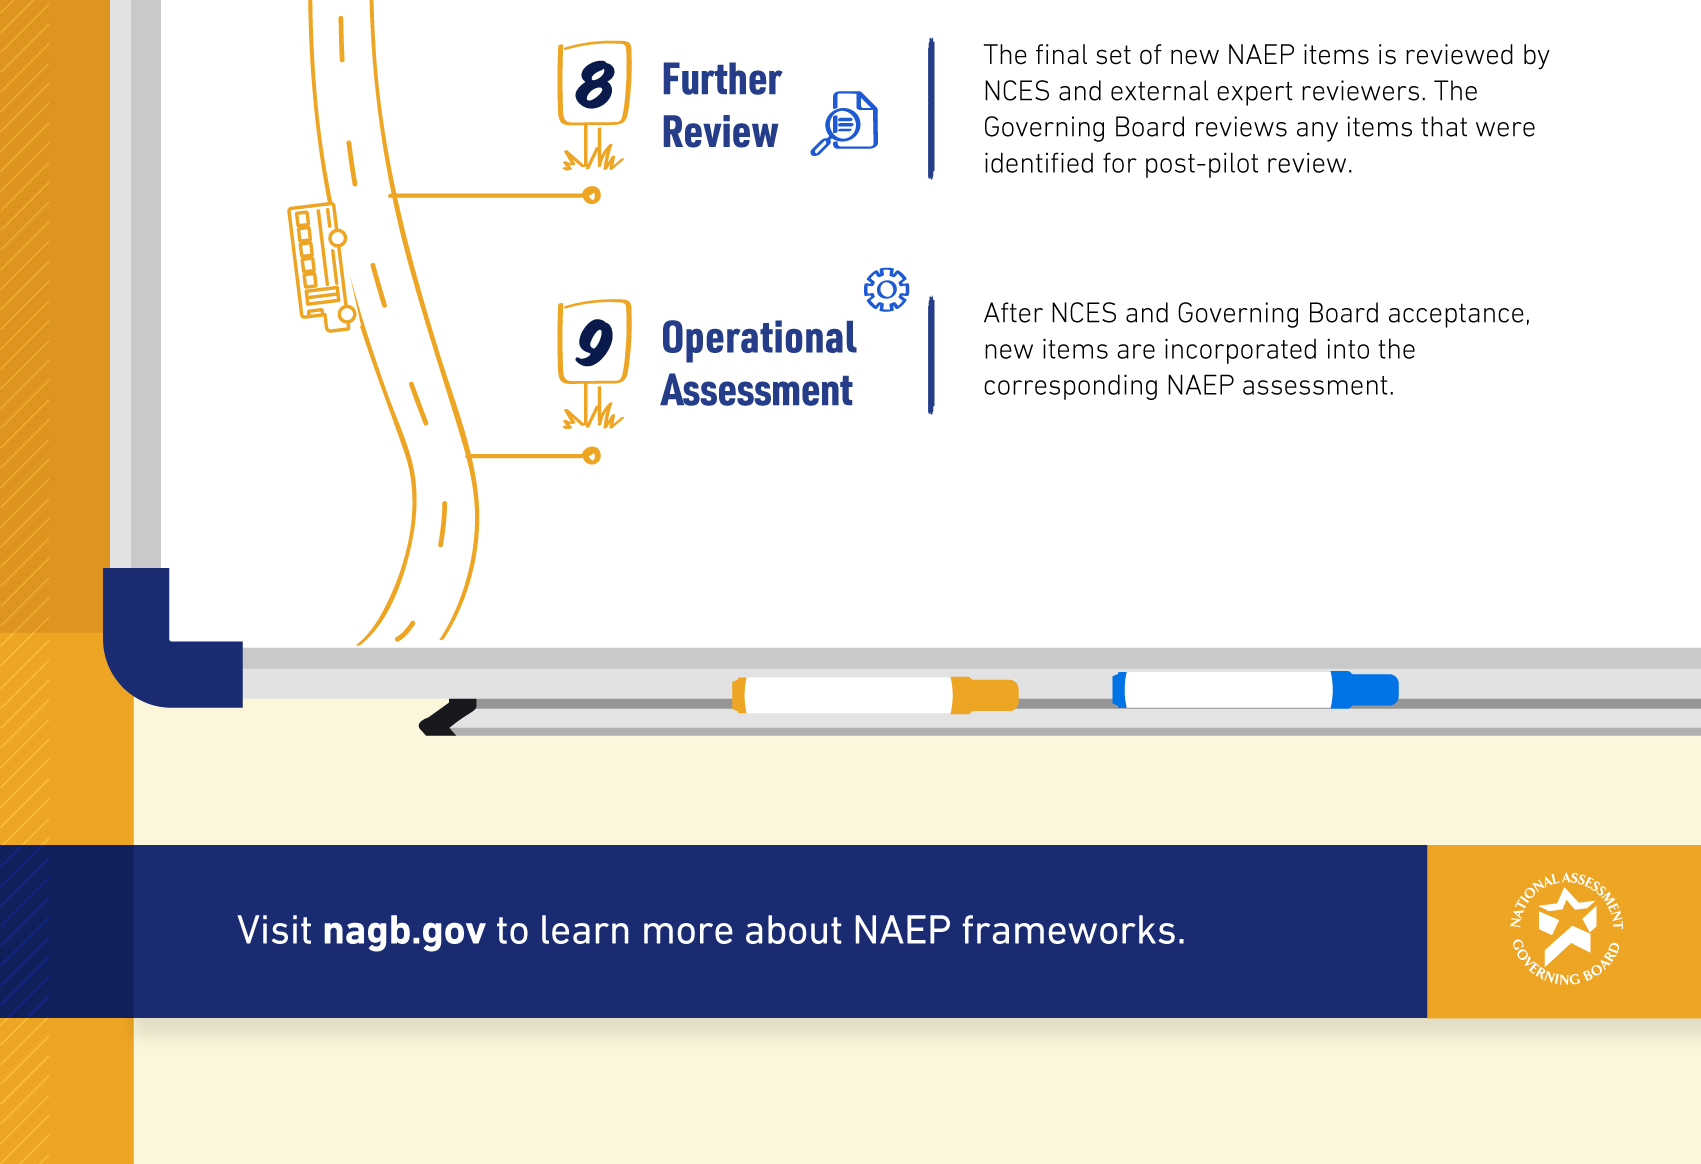
With the Governing Board and our team at Hatcher, I designed two infographics that describe the multi-year process of how a NAEP framework is developed and implemented.

TUDA Score Improvement Infographic
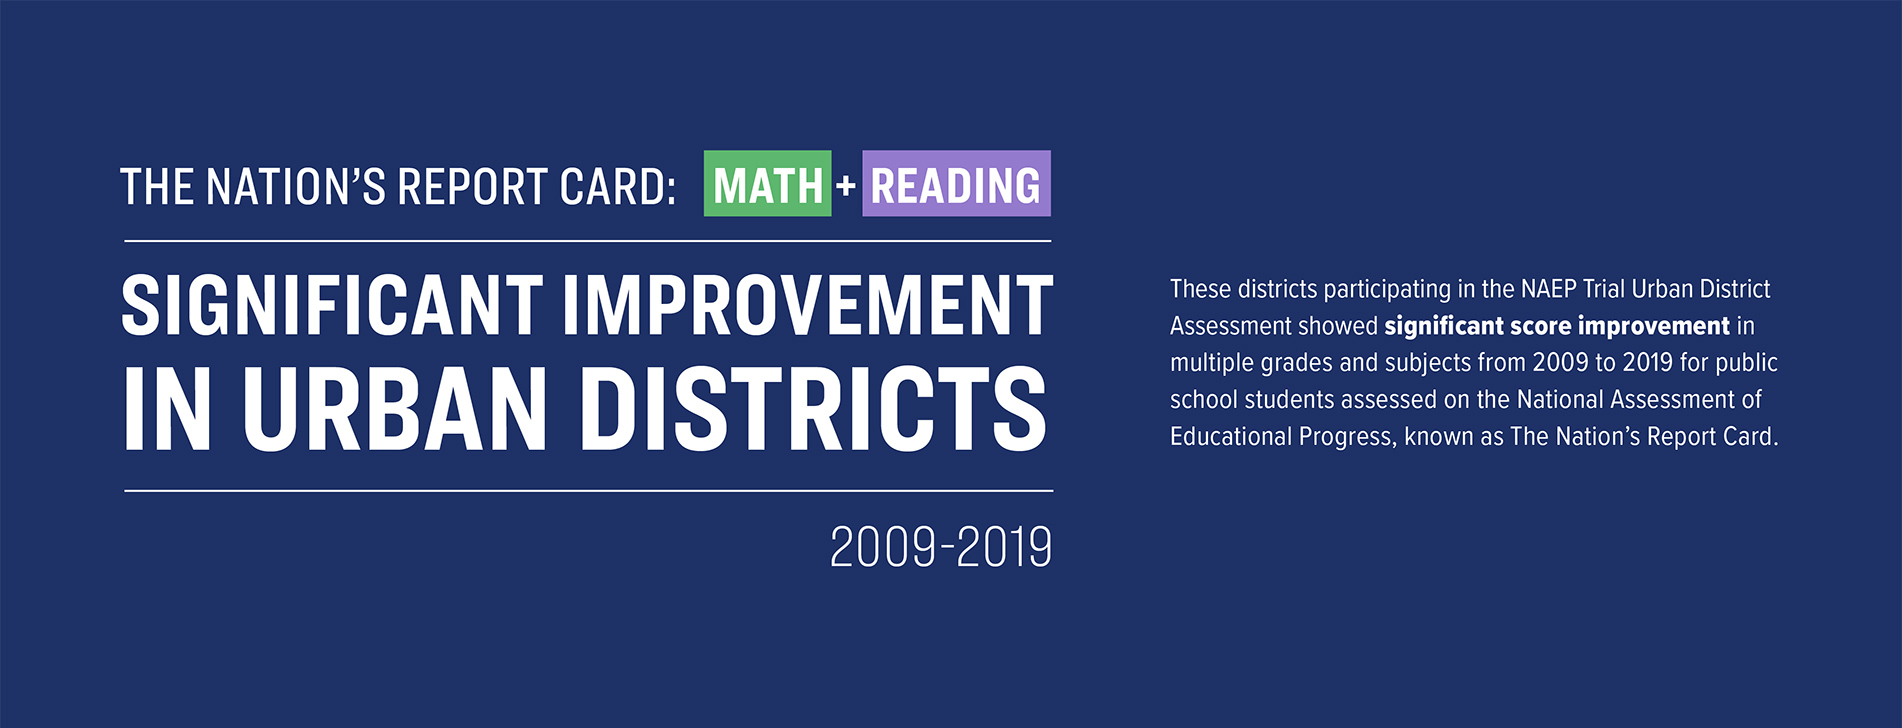
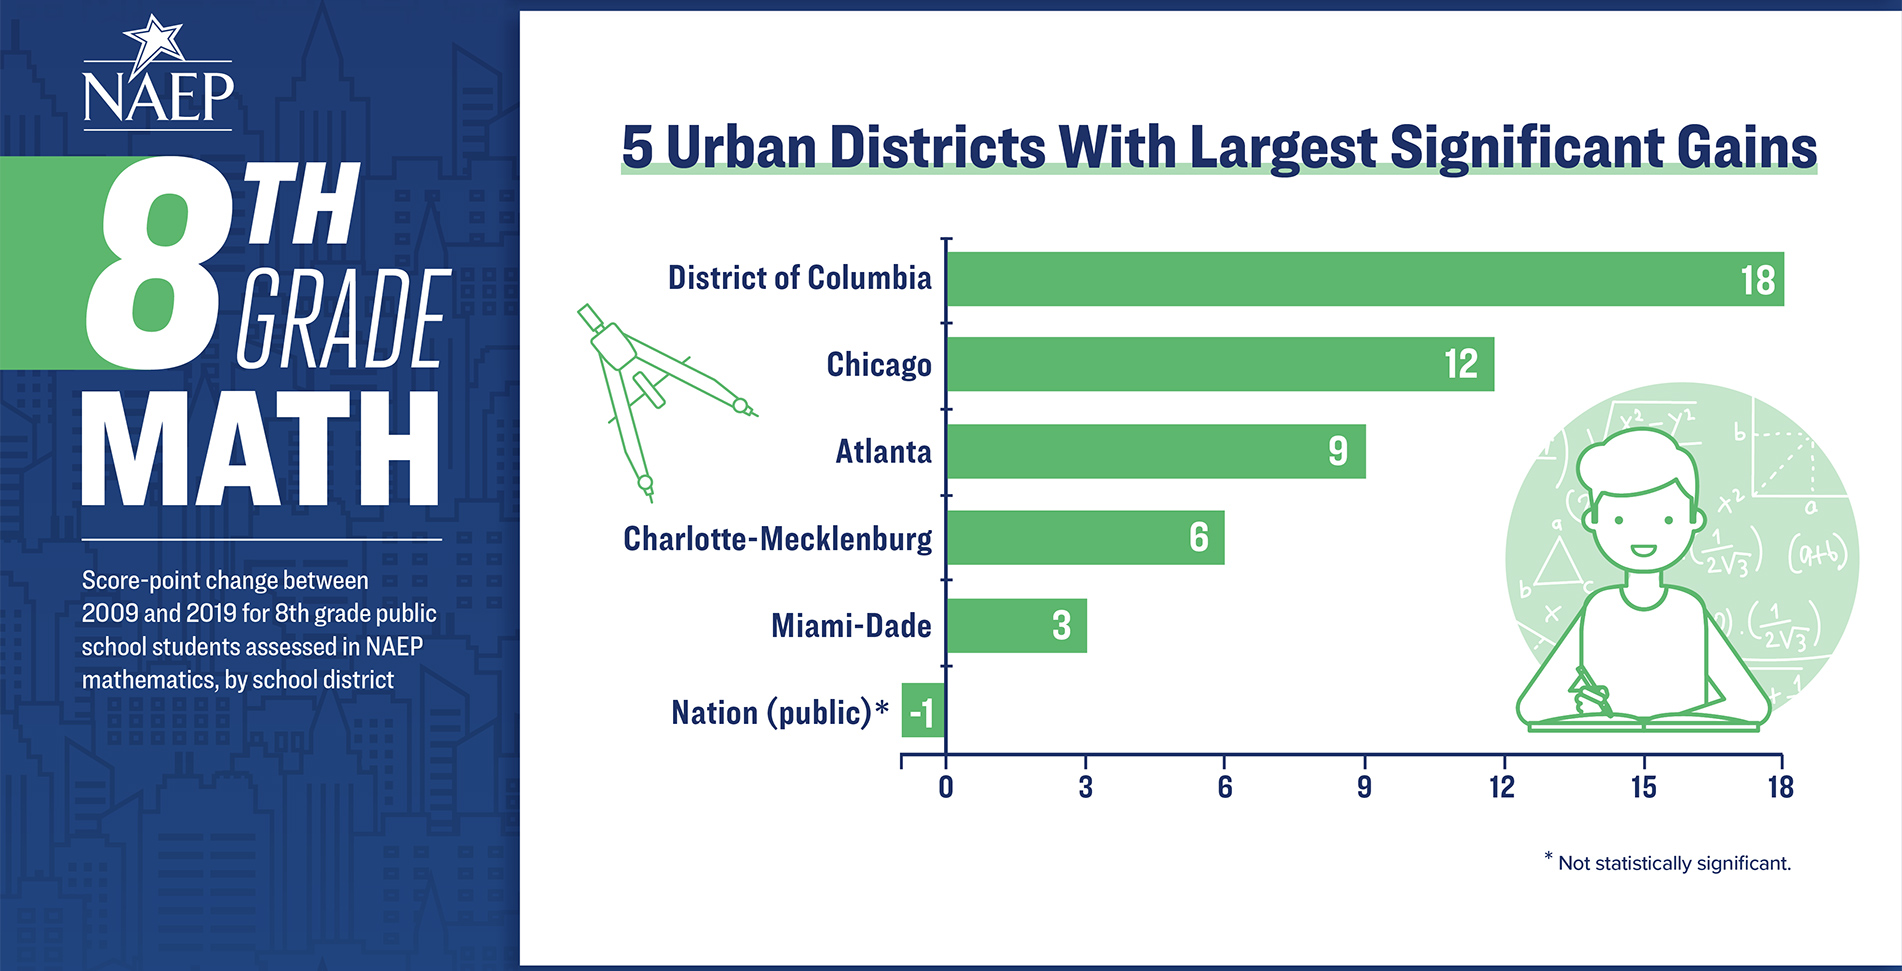
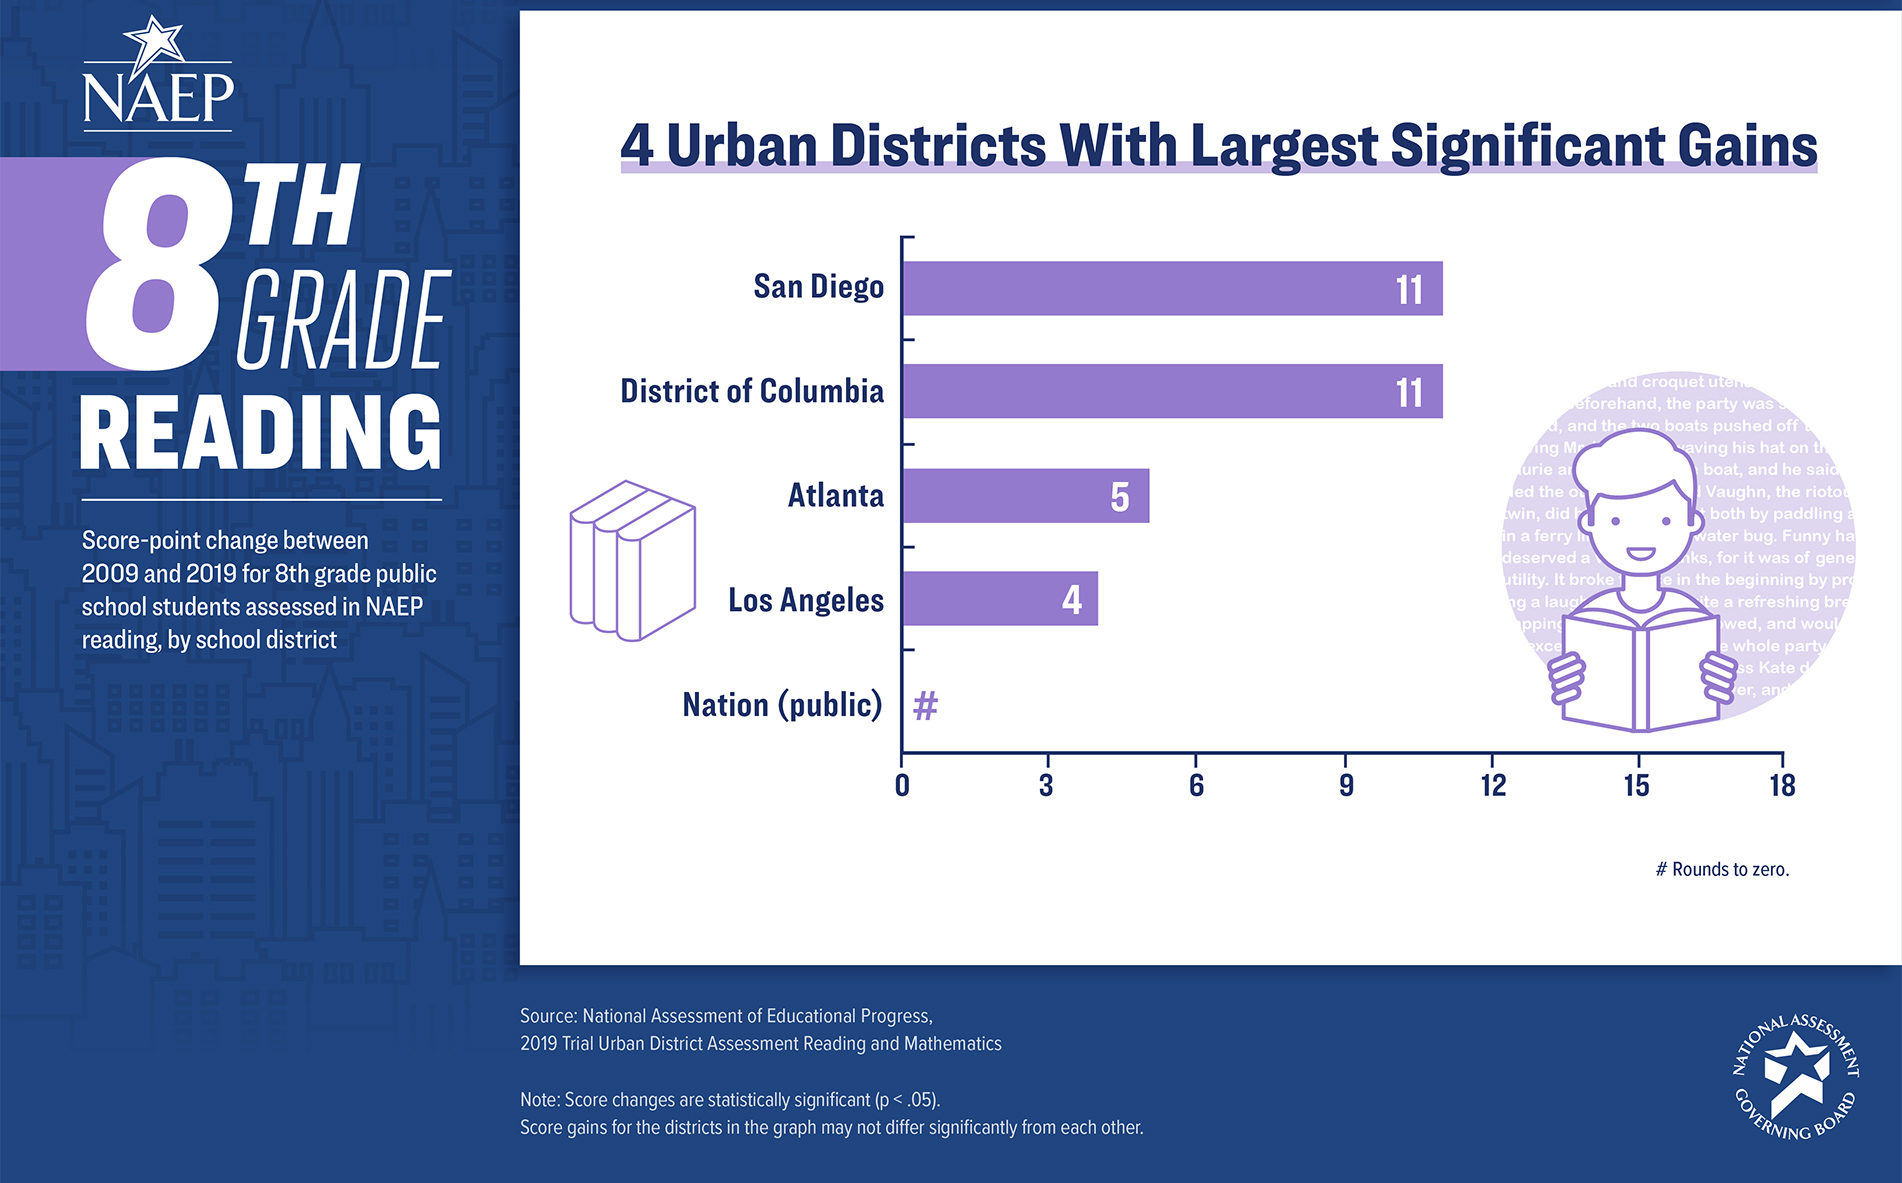
Urban school districts that are large enough and meet certain requirements can participate in the Trial Urban District Assessment (TUDA), which shows their performance over time in comparison to other participating districts.
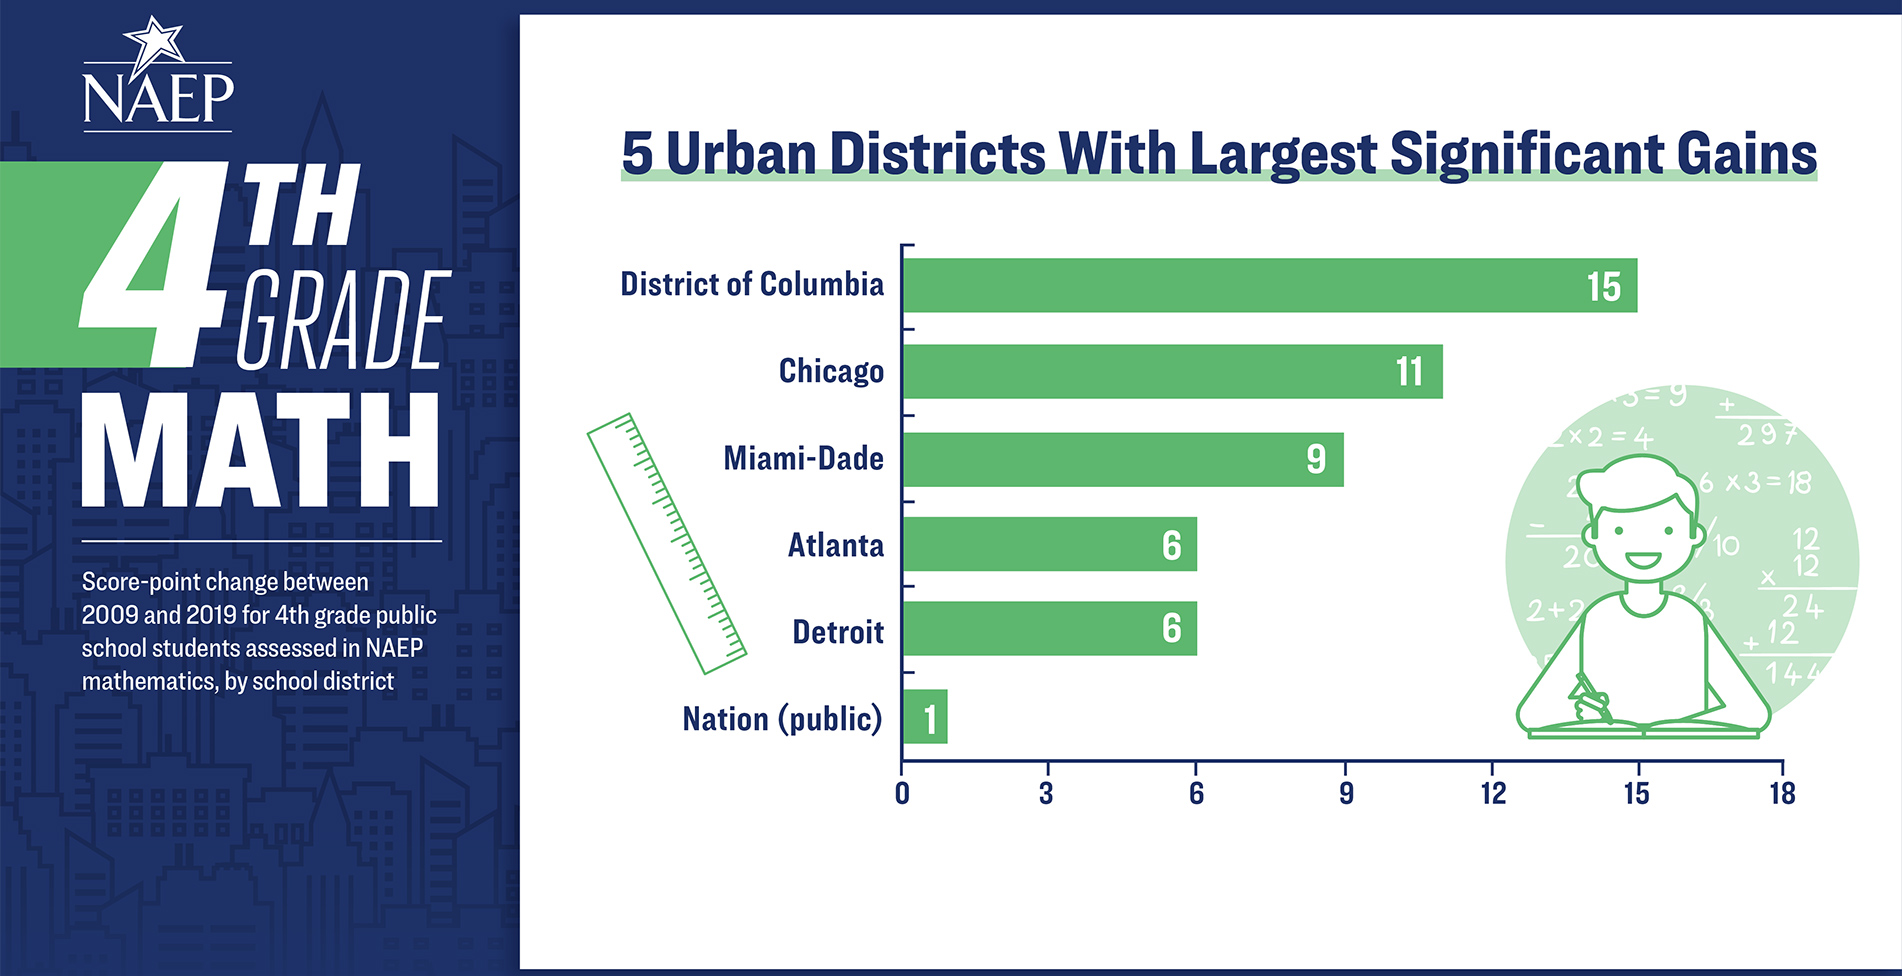
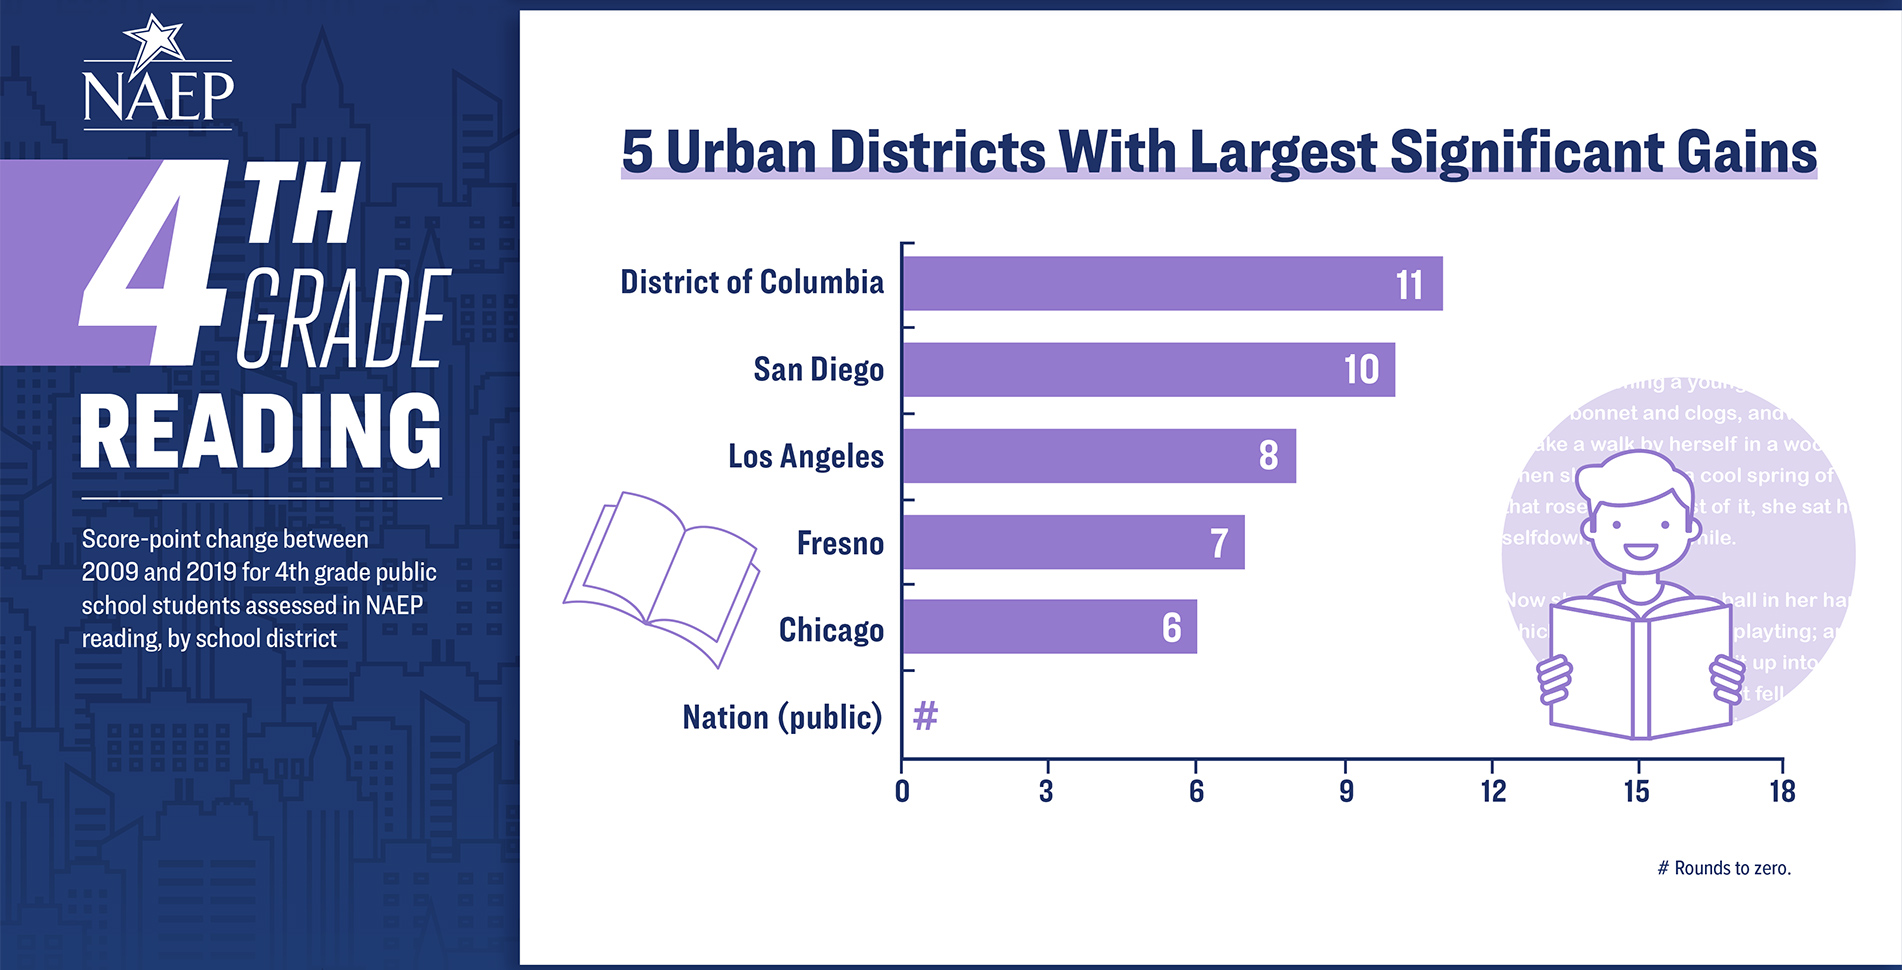
This infographic highlights the TUDA districts that achieved the highest, statistically significant improvement in 4th and 8th grade math and reading scores in the past decade.
To keep the graphic from becoming a repetitive collection of bar graphs, I used icons of students to personify each section. The 4th grade math student is shown doing basic mathematics, while the 8th grade math student is dipping their toe into algebraic functions. The 8th grade reading student is reading a much denser text than the 4th reading student.
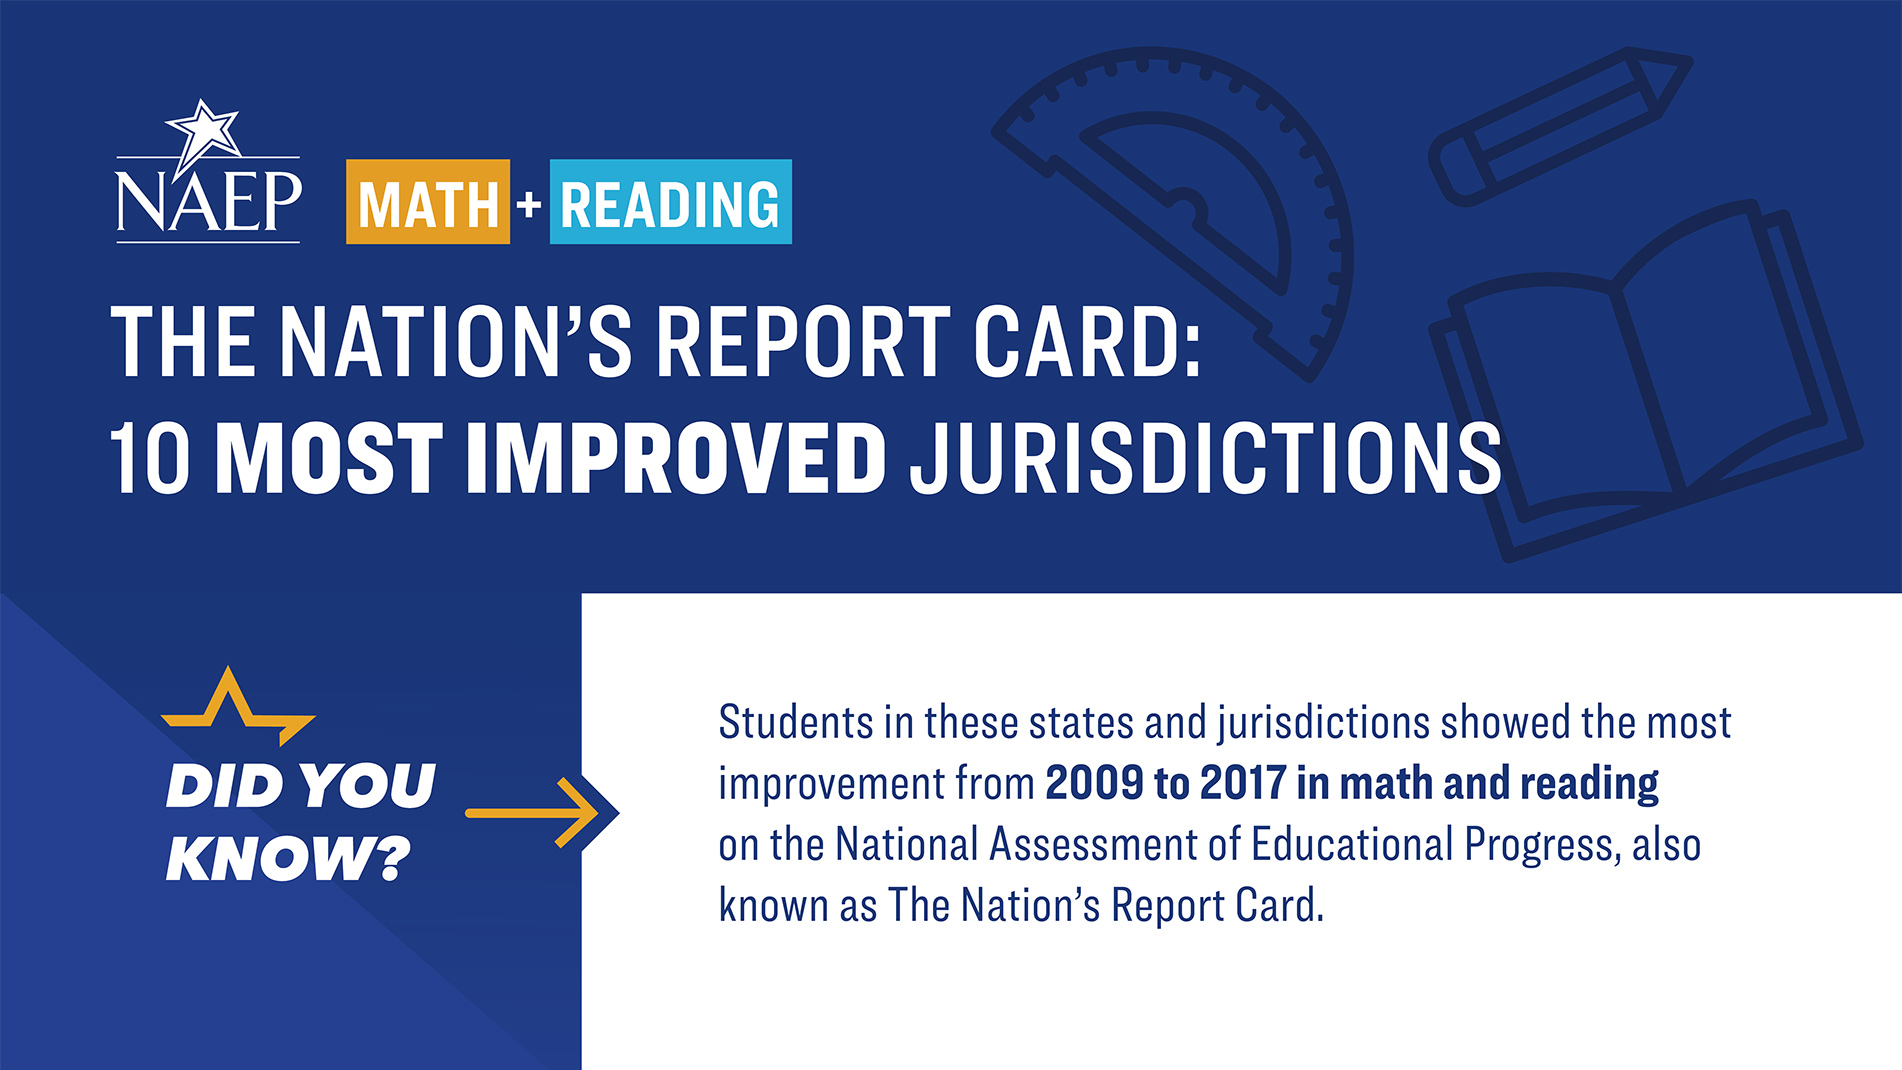
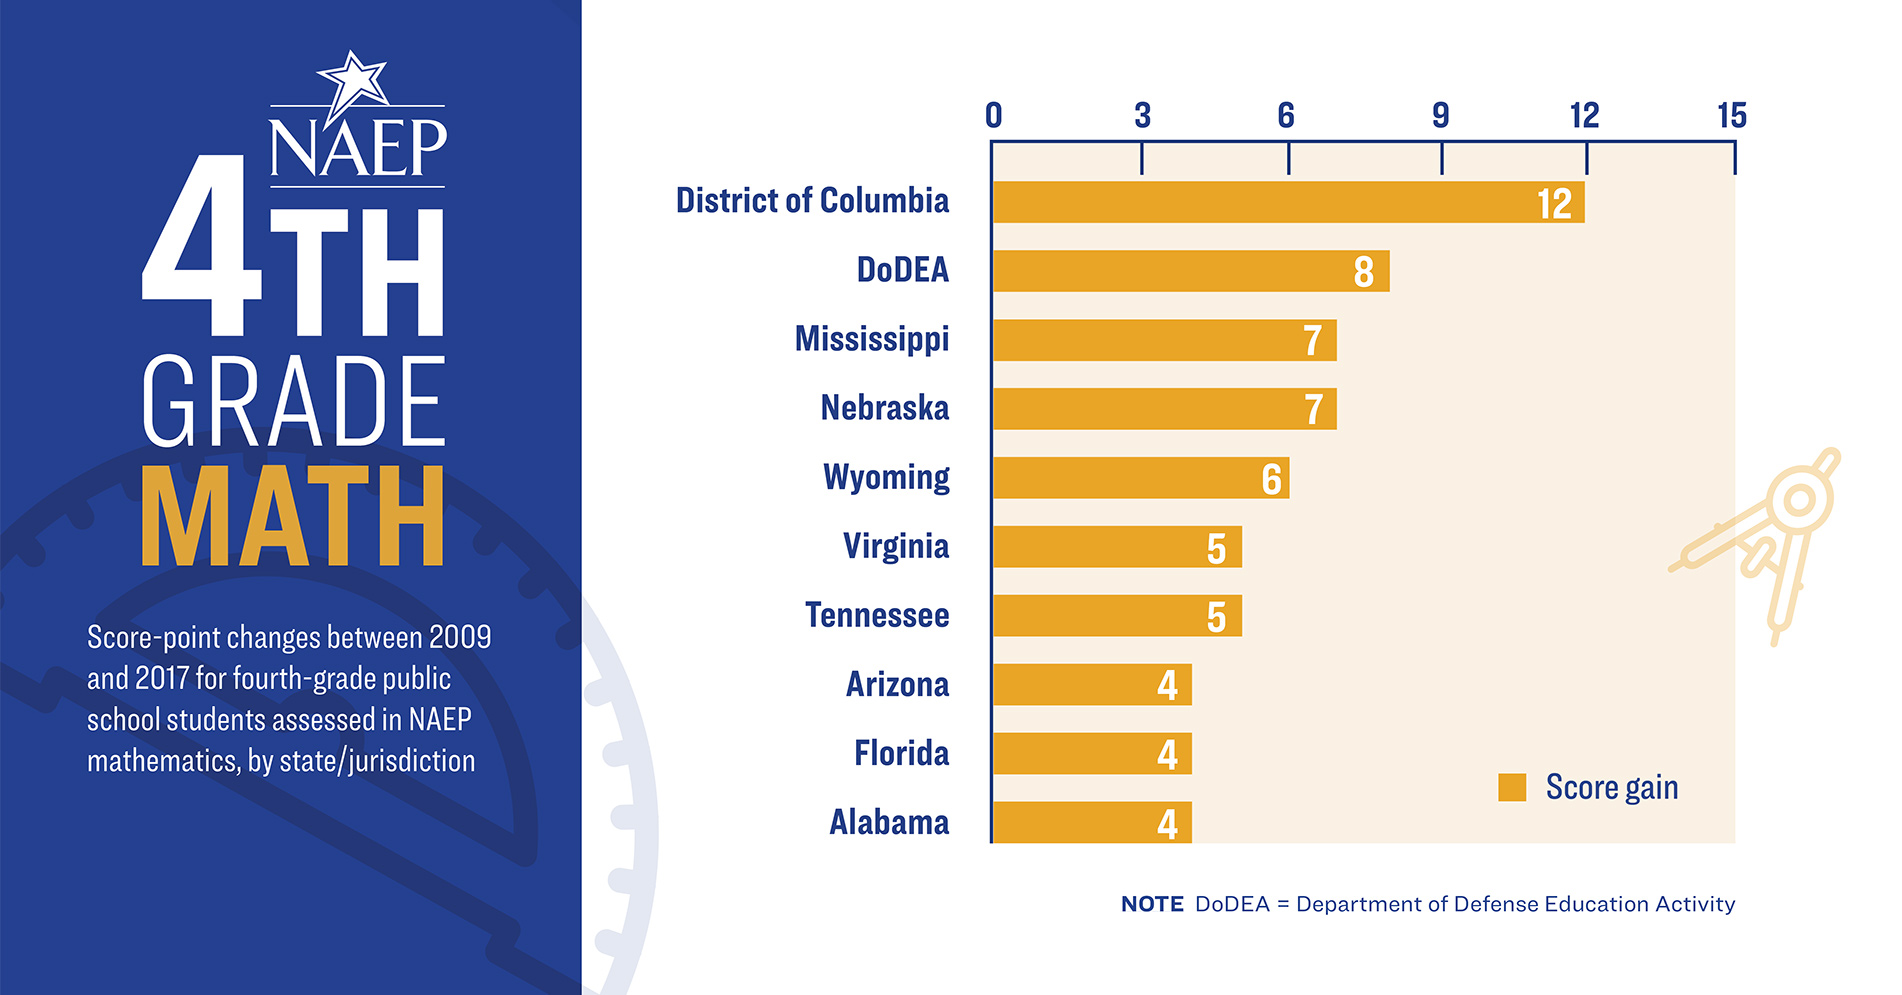
NAEP Score Improvement Infographic
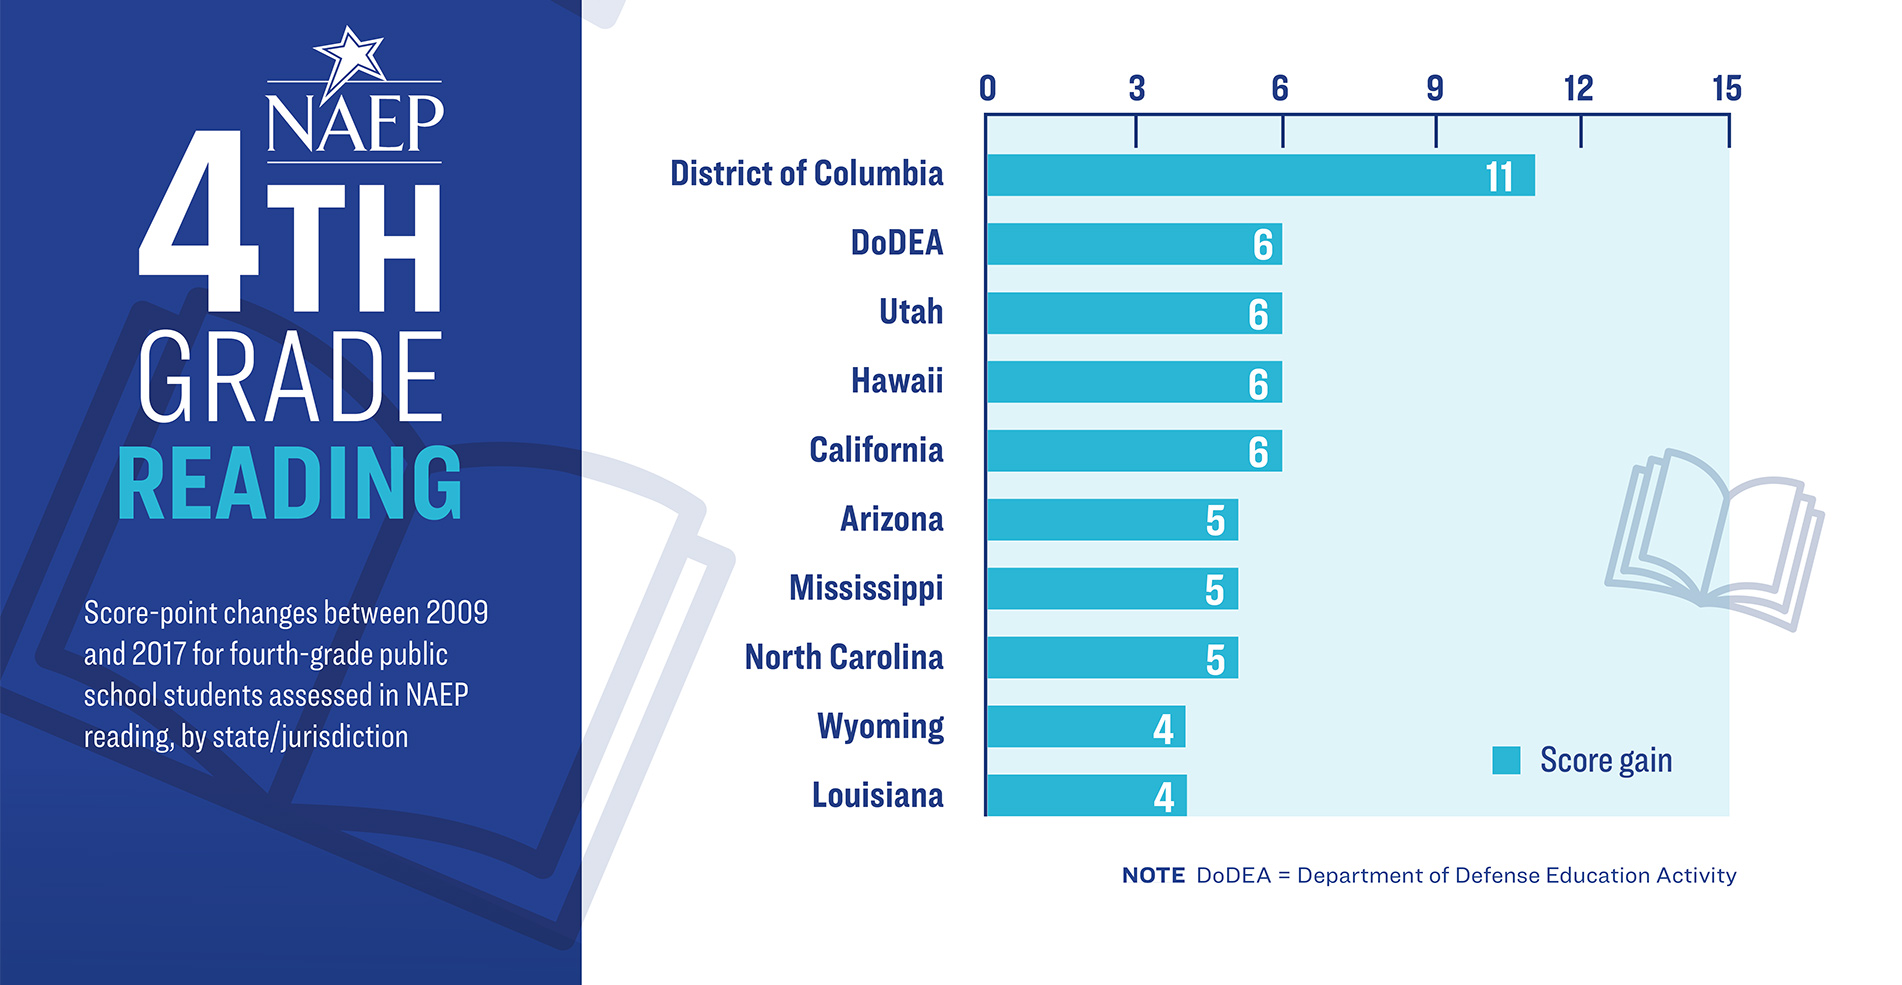
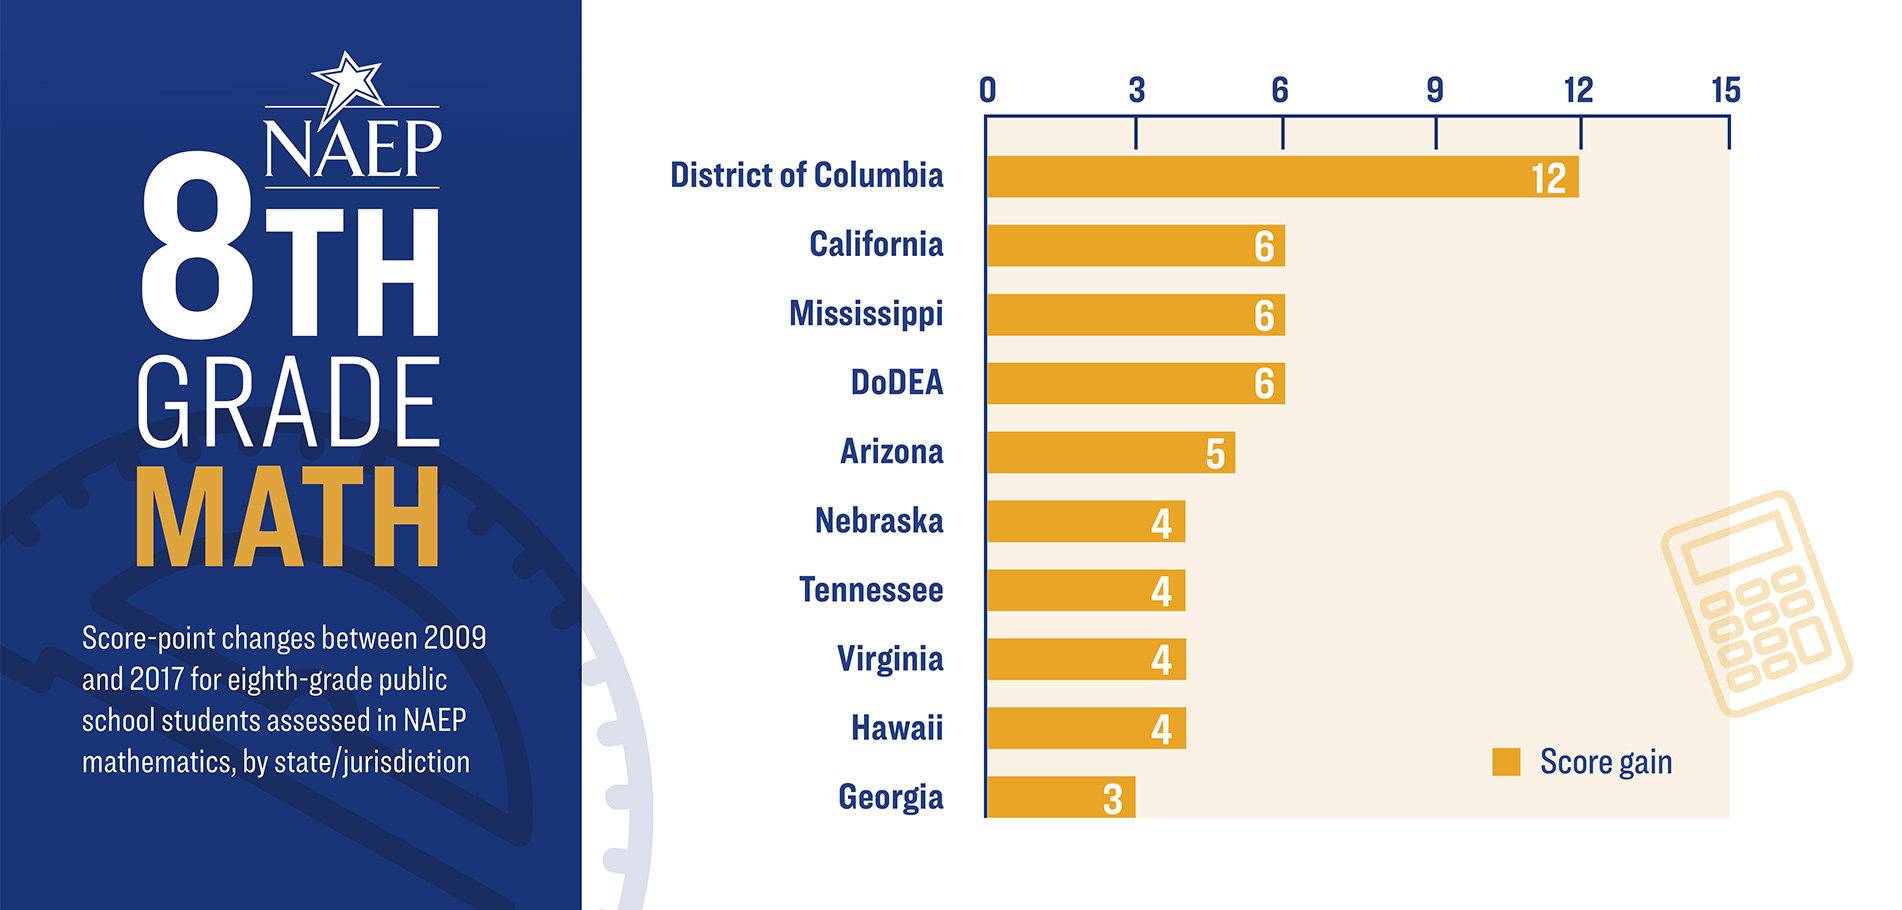
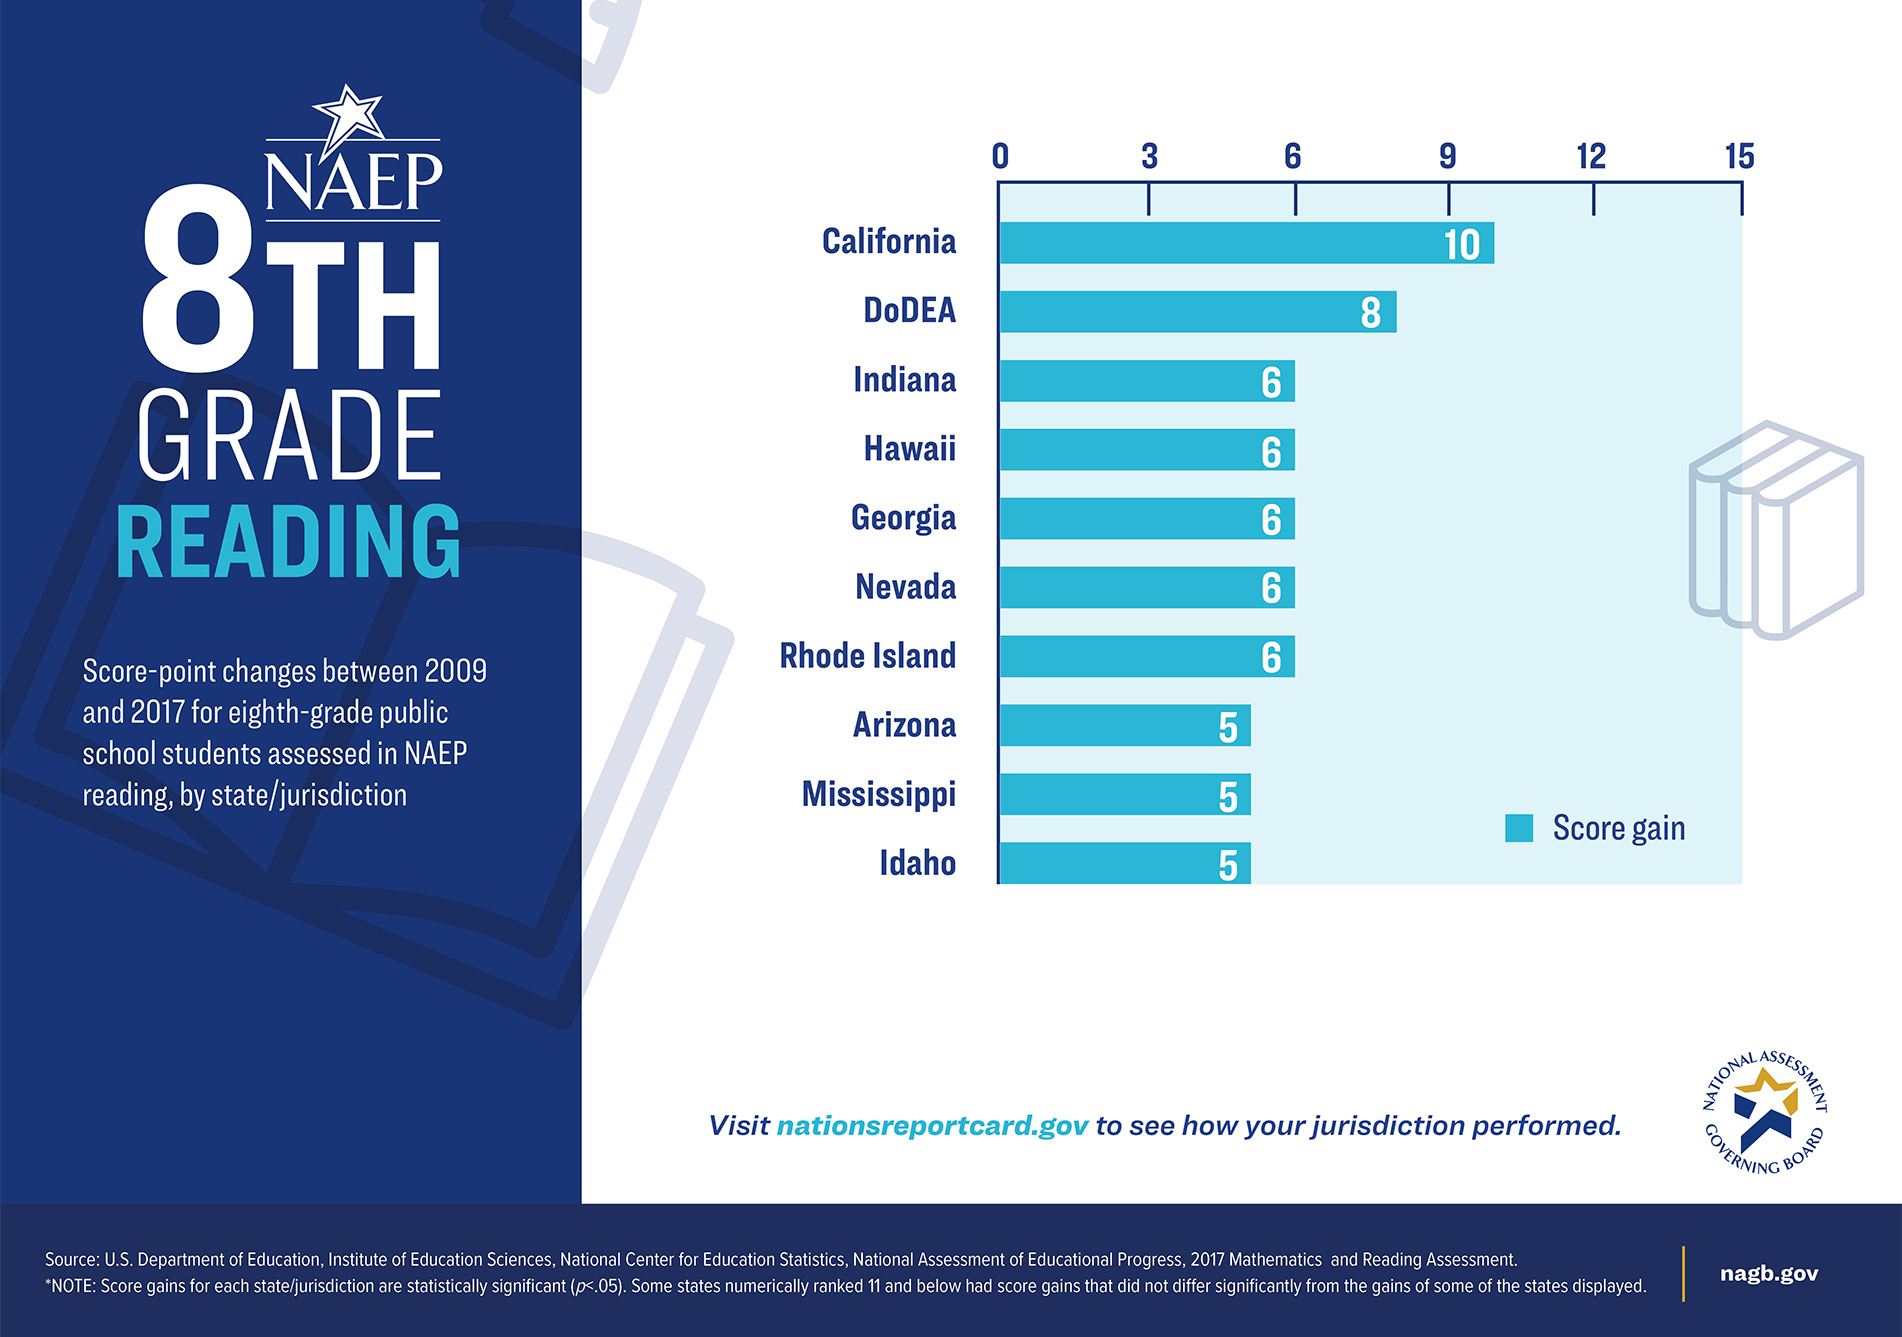
Similarly to the above, this infographic shows the states/jurisdictions with the highest, statistically significant improvements in 4th and 8th grade math and reading scores in the past decade.
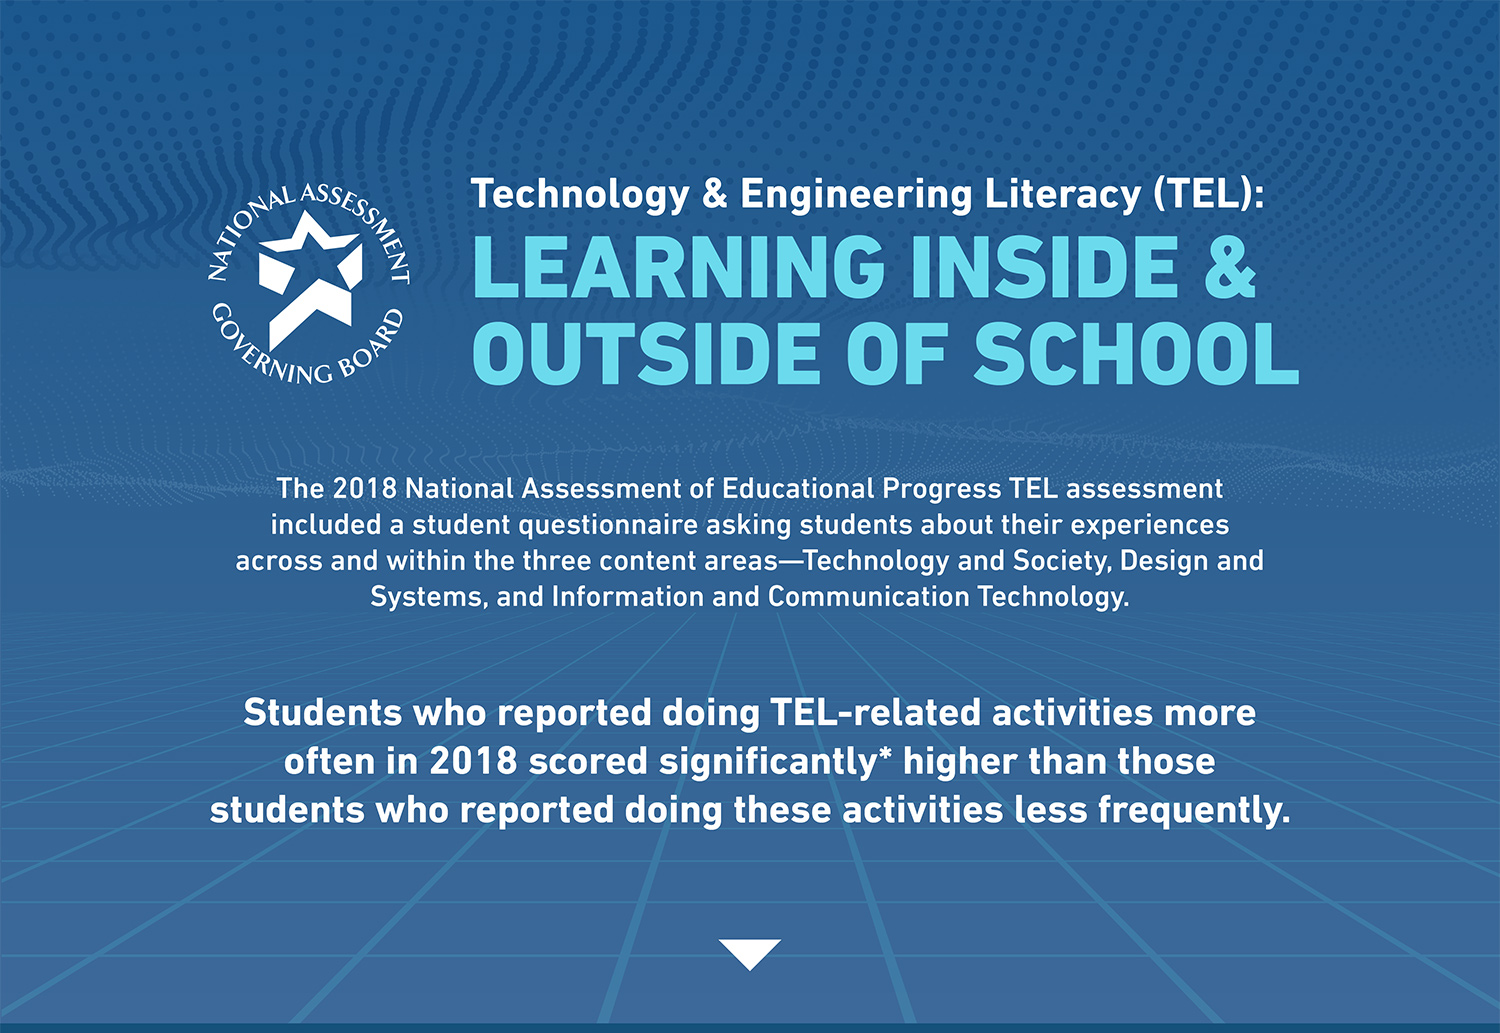
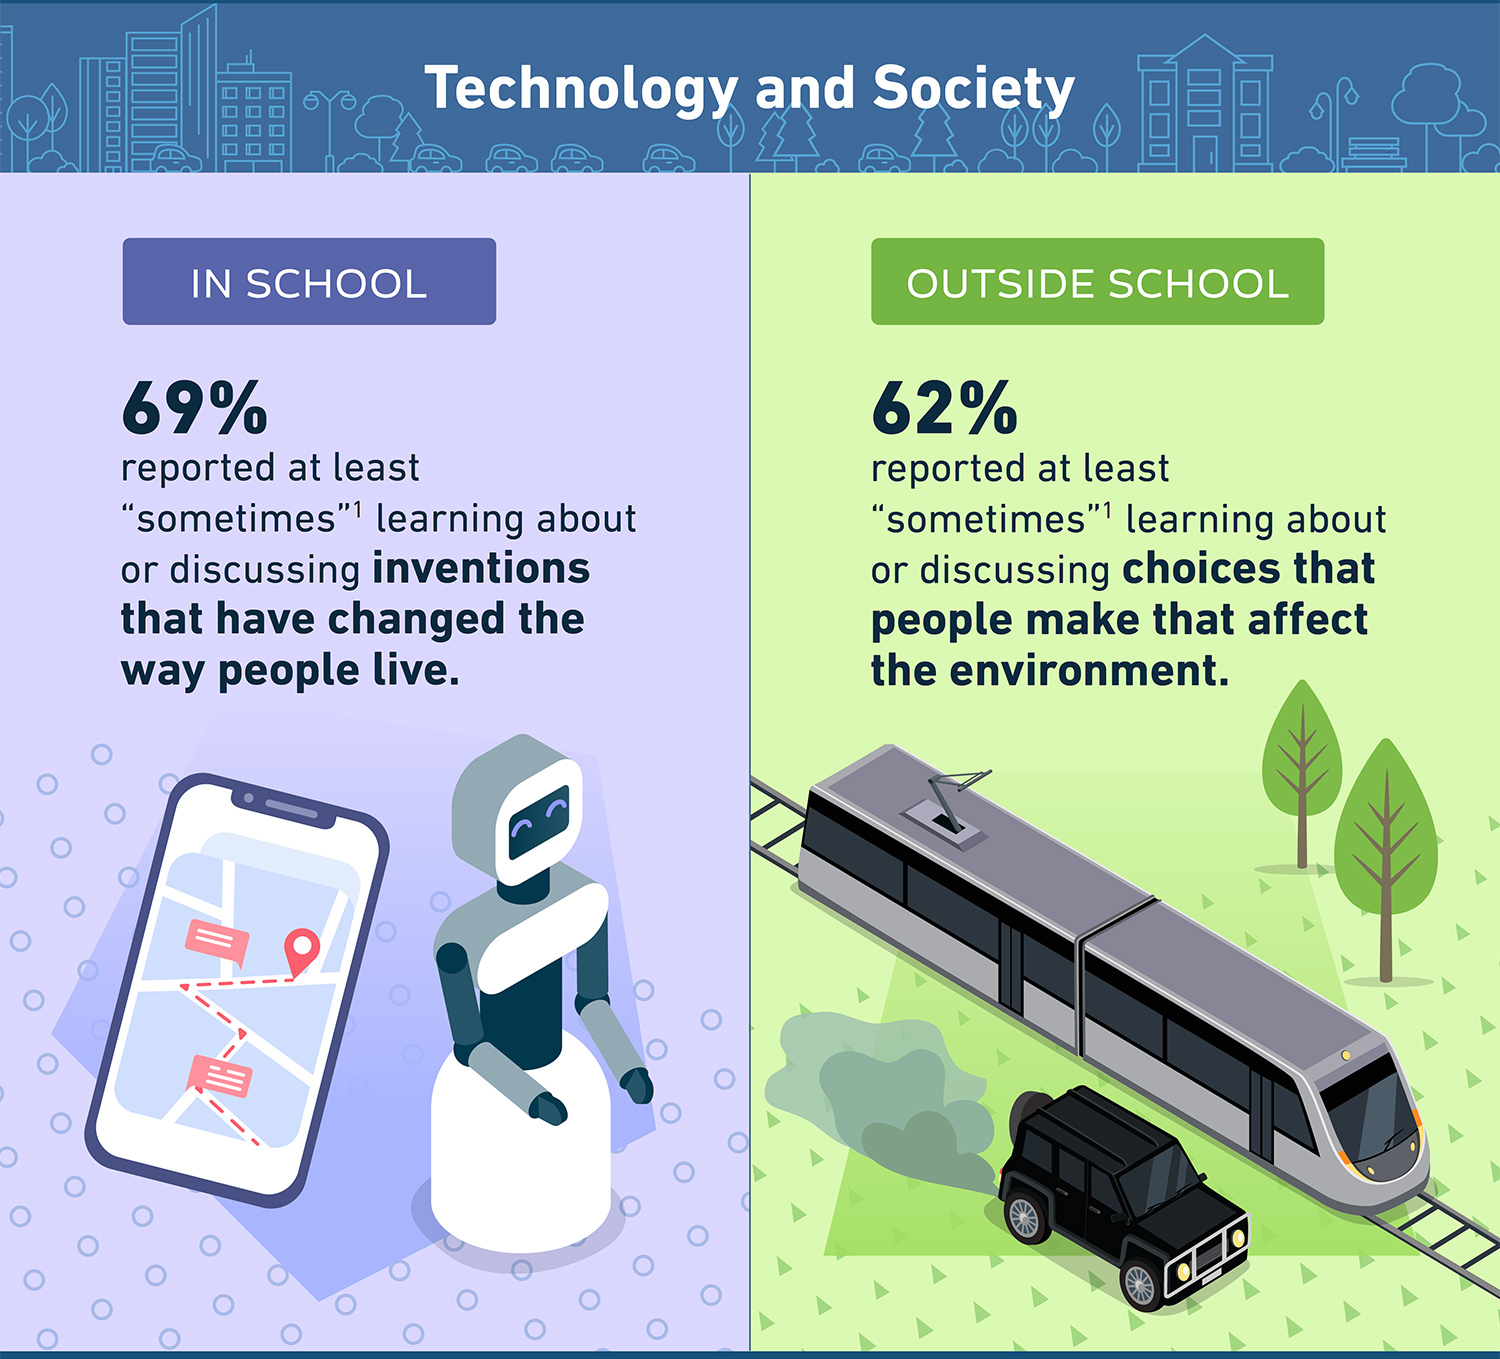
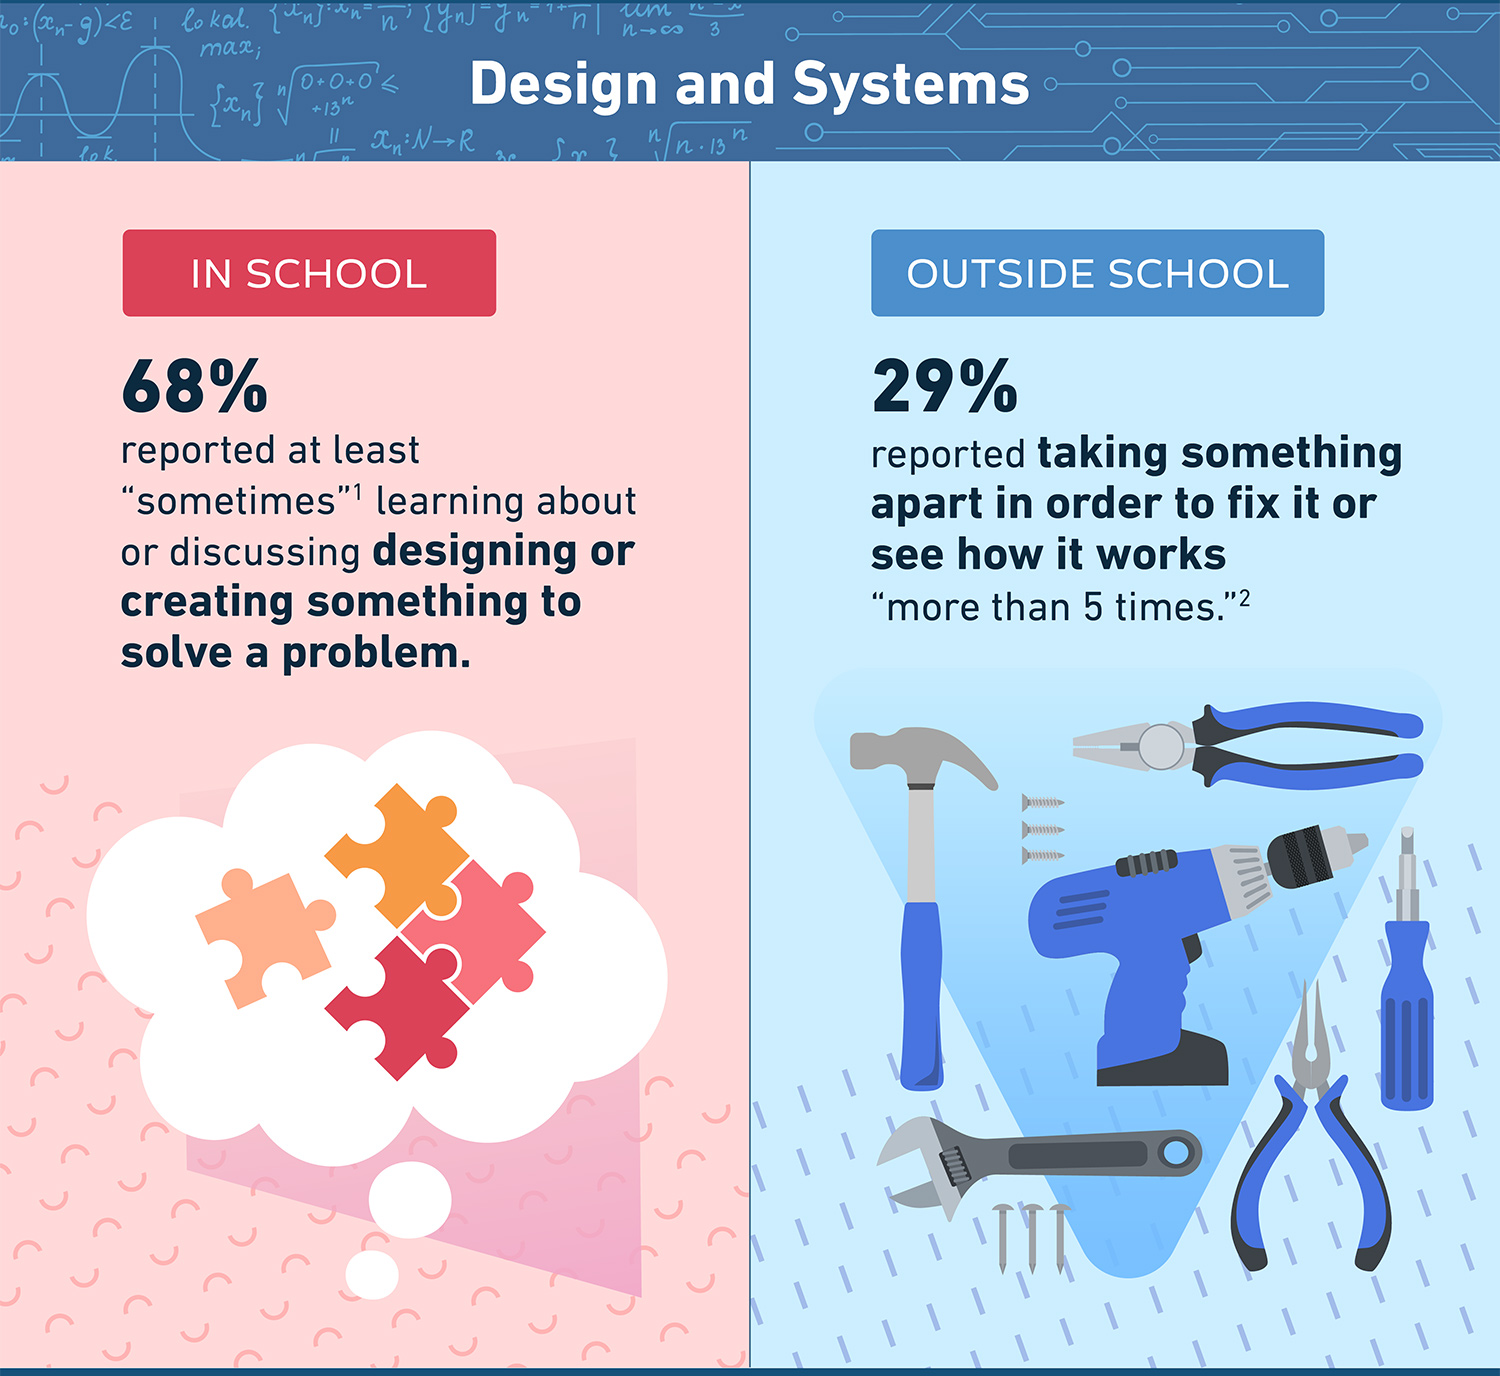
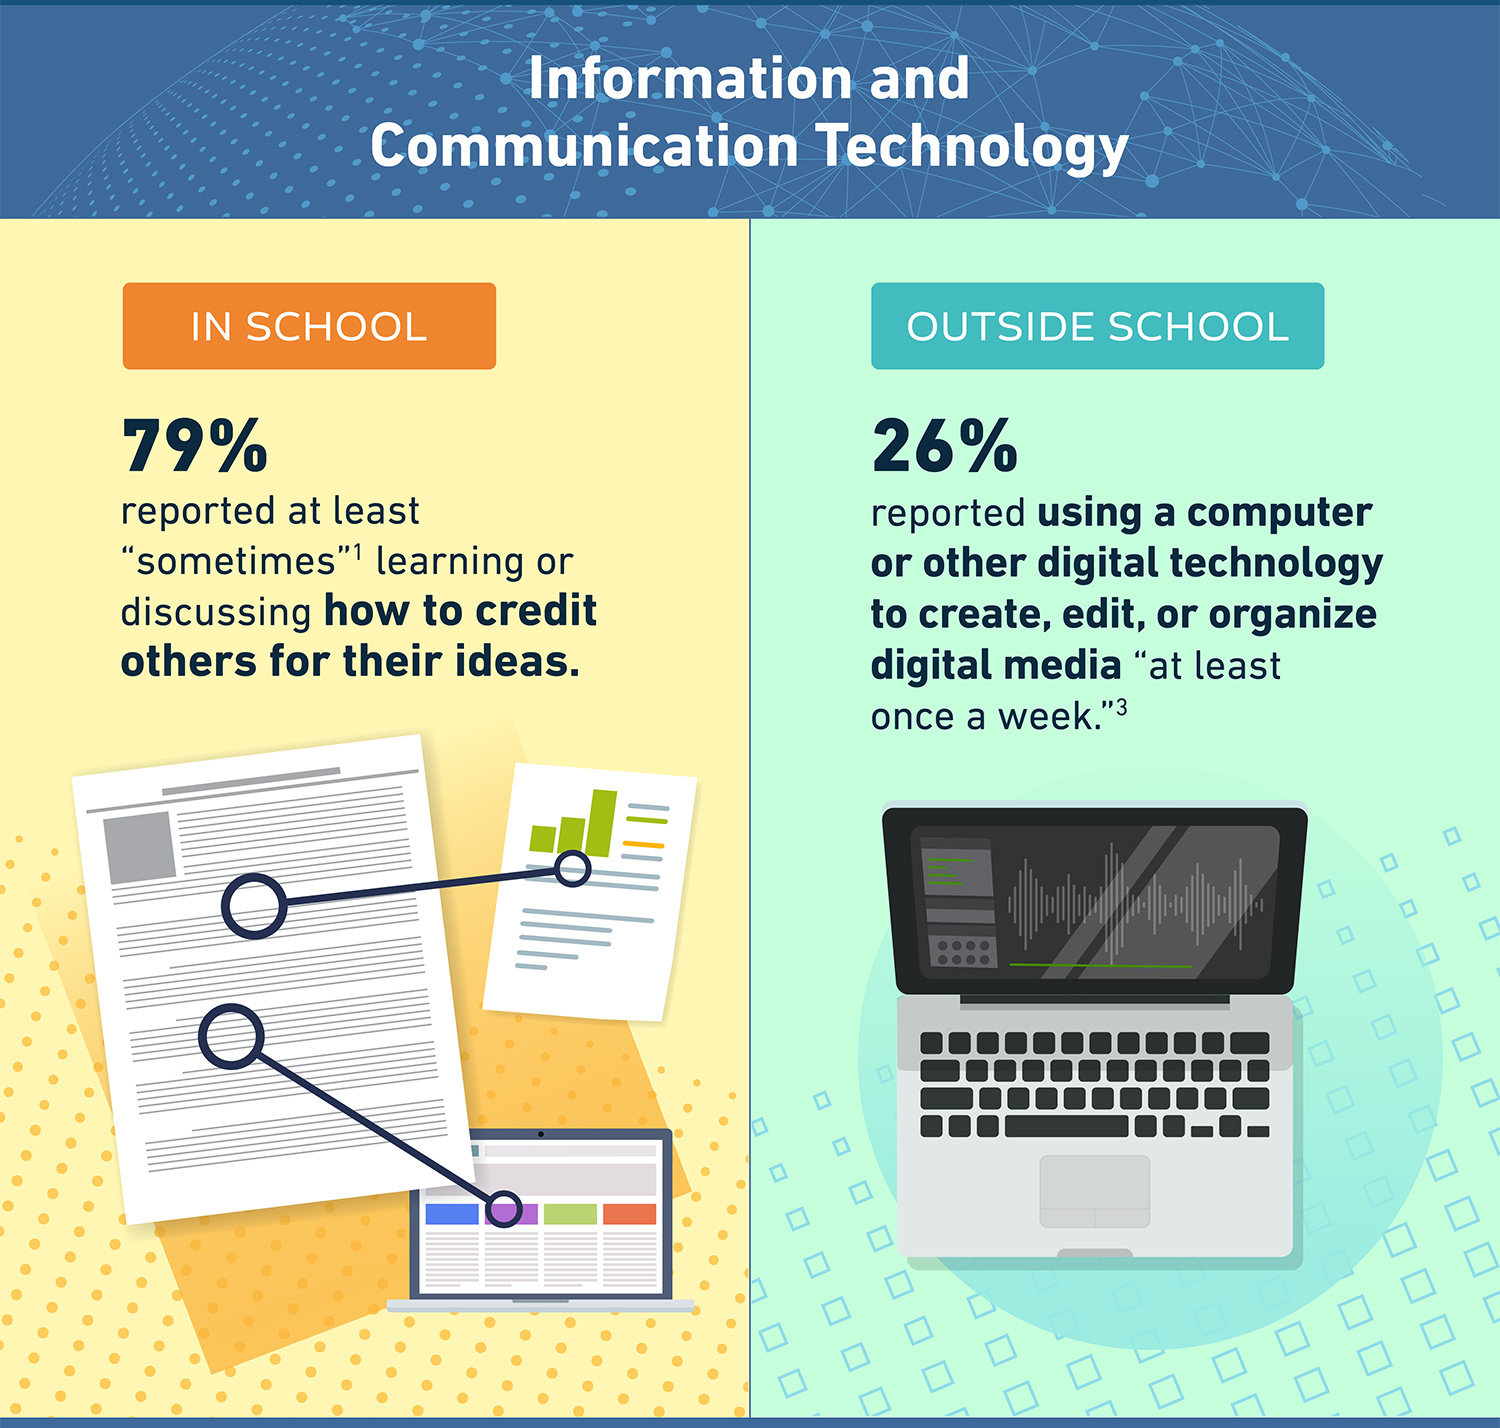
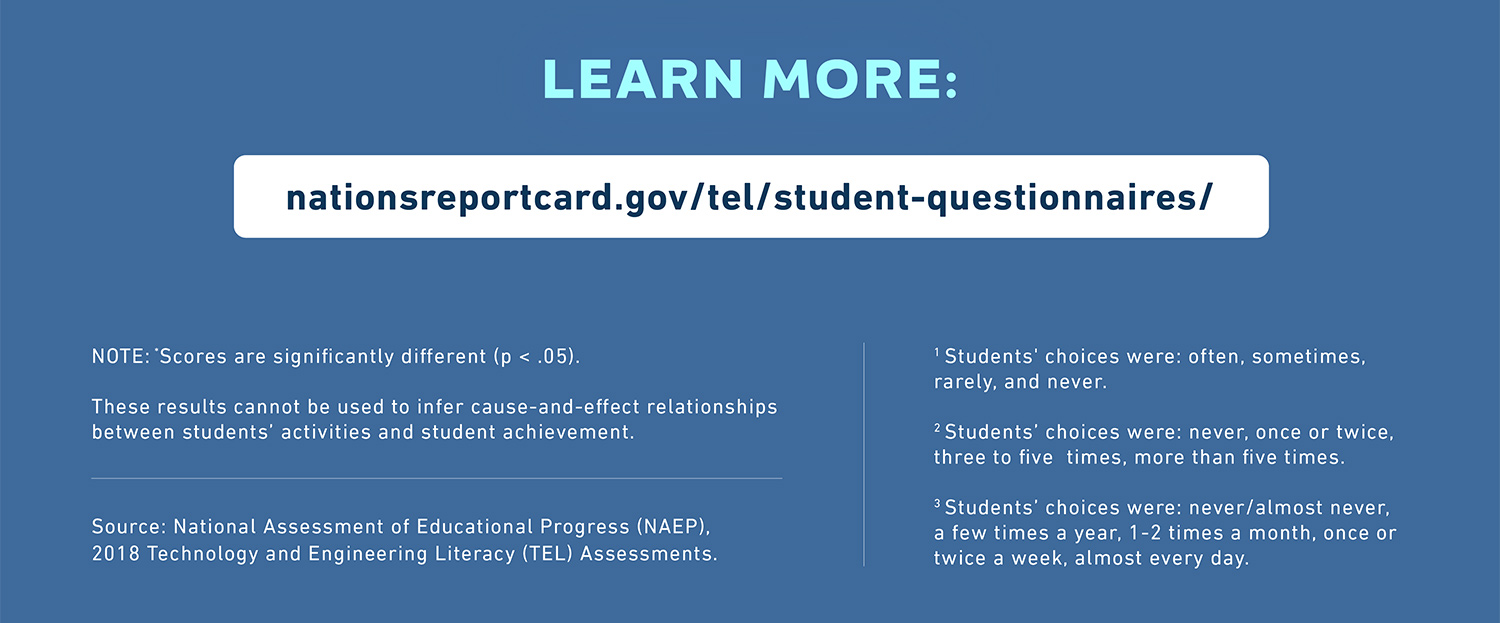
TEL Infographic
Not all of the infographics for The Governing Board display strictly score-related data. The Technology & Engineering Literacy (TEL) assessment included questions that asked students how they learn about and experience technology.
Let's chat: aedallena@gmail.com
Let's connect: Linkedin